Are your savings above or below the UK average? Traditionally, saving money serves a dual purpose: building a safety net for life's uncertainties and bringing bigger milestones within reach, whether that means buying a first home or enjoying a comfortable retirement.
Today, however, the role of saving has fundamentally shifted. According to Hodge Bank, many households are trying to balance two pressing concerns: protecting their long-term financial future and navigating the rising cost of living. As a result, how much people save reflects not only their future goals but also what they can realistically afford to set aside today.
Nevertheless, savings look different for everyone, depending on factors such as age, income, location and personal goals. Yet, despite these differences, the average UK savings offers a common point of reference to help put individual finances into perspective.
So, how do your savings compare with those of the average British person?
This article explores the figures behind average British savings and compares savings across different age groups and regions. It also looks at the factors influencing savings, helping you understand why savings vary and how they shape your financial position.
- What Counts as Savings?
- How Much is The Average Savings in the UK?
- What is the Average Amount of Savings in the UK by Age?
- What is the Average Savings by Region in the UK?
- Why Might Your Savings be Above or Below the UK Average?
- Average Person’s Savings in the UK: Turning Comparisons Into Progress
- Average Savings UK: Frequently Asked Questions
What Counts as Savings?
Savings are funds set aside from income after covering expenses and financial commitments. This money is typically kept as:
- Cash held in accessible bank accounts, ready to cover emergencies or unexpected expenses.
- Low-risk, interest-earning accounts to grow money over time.
The following financial assets that are considered savings include:
- Cash in Current Accounts: Funds held in everyday bank accounts that can be accessed for bills, purchases, and emergencies.
- Cash Individual Savings Account (Cash ISA): A UK savings account, offering tax-free interest, subject to ISA rules.
- Cash in Savings Accounts: Money deposited in bank accounts that earn interest and withdrawn when needed.
- Fixed-Term Deposit: Money placed within a bank for a set period in exchange for a fixed or agreed interest rate, sometimes with restrictions on early withdrawal.
- Money Market Accounts: Interest-bearing bank accounts that typically offer relatively low-risk returns and access to funds, depending on the account terms.
- Physical Cash: Money kept at home or in a wallet for immediate expenses or emergencies.
While all these savings options help set money aside, they vary in accessibility, potential interest earnings, and withdrawal restrictions. Understanding these differences matters, as they determine which account suits immediate, short-term needs versus longer-term financial goals.
How Much is The Average Savings in the UK?
Discover the average savings per person and household in the UK, and see how yours compare.
Average Savings Per Person
Research from Finder in 2026 shows that the average UK savings stand at £19,214 per person. However, this figure may not reflect what most people have set aside, as larger savings can push the average upwards. This is particularly relevant for older age groups; people under 55 have average savings of £9,888, considerably less than the overall figure.
Despite the overall average, several people in the UK have far less set aside. Finder's research found that 39% of Brits have £1,000 or less in savings, while 25% have £200 or less. With such limited reserves, they may struggle to cover everyday expenses for more than a month if their income is disrupted.
Average Savings Per Household
Looking at household finances gives another perspective. The Office for National Statistics’ (ONS) Wealth and Assets Survey reports an average household gross financial wealth of £76,301, which includes money held in current and savings accounts, ISAs, shares, bonds, trusts and other financial assets.
However, the mean alone does not show how much a typical household has saved, as a relatively small number of households with substantial financial assets can raise the overall figure. The median offers a more representative comparison: half of households have less than this amount, while the other half have more.
According to the survey, median household gross financial wealth is £12,500, up from £11,000 two years ago. The figures also reveal how unevenly savings are distributed, with 25% of households holding less than £2,100 in gross financial wealth. This means that although the UK’s average household savings may appear substantial, many households have considerably less set aside.
In summary:
- According to Finder, the average UK savings per person reached £19,214 in 2026.
- People under 55 have an average savings balance of £9,888.
- 39% (2 in 5) of Brits have £1,000 or less in savings, while 25% (a quarter of Brits) have £200 or less.
- Average household gross financial wealth in the UK stands at £76,301, said ONS.
- The median household gross financial wealth is £12,500, up from £11,000 two years ago.
- 25% of UK households have less than £2,100 in gross financial wealth.
What is the Average Amount of Savings in the UK by Age?
Savings vary with age, as people’s incomes, expenses and financial priorities often change throughout their lives:
- Younger adults (18-24) are often studying or just starting their careers, with entry-level or part-time earnings, which leaves little money to save after essential expenses.
- Adults aged 35-54 may see their savings plateau or dip slightly as they manage mortgage payments, raise children, or cover childcare and education costs.
- Older adults (55+) may have accumulated more savings over time, as regular deposits and compound interest gradually increase their balances.
Finder’s 2026 research reflects this difference, reporting average savings by age in the UK:
| Age Group | Average Savings |
|---|---|
| 18-24 | £2,699 |
| 25-34 | £11,023 |
| 35-44 | £13,379 |
| 45-54 | £12,452 |
| 55 and above | £33,420 |
Reference: Finder survey, 2026
In essence, savings tend to grow as people get older. Finder’s survey highlights this pattern, with the UK’s average amount of savings increasing from less than £3,000 among 18 to 24-year-olds to over £11,000 among 25 to 34-year-olds. This suggests that people generally build up greater savings as they progress through different stages of life.
Growth then appears to slow among adults aged 35 to 44 and 45 to 54, potentially reflecting major life expenses, such as buying a home or raising children, which can limit how much they put aside.
Average savings by age 55 and over rise sharply, reaching £33,420. By this point, people may have had more time to build their savings and prepare for major expenses or retirement.
Read More: How To Build Wealth In Your 30s: A Practical Financial Foundation Guide
What is the Average Savings by Region in the UK?
Finder’s 2026 survey shows that average savings differ considerably across the UK, with some regions recording much higher balances than others:
- The East of England ranks highest, with average savings of £26,778, followed by the South East at £22,404 and Greater London at £21,266.
- Northern Ireland records the lowest average at £8,421, about a third of the East of England's figure.
- Wales also falls towards the lower end, with average savings of £12,038.
To compare savings across the country, the table below breaks down the average amount saved by UK region.
| Region | Savings |
|---|---|
| East of England | £26,778 |
| South East | £22,404 |
| Greater London | £21,266 |
| North West | £20,838 |
| West Midlands | £20,181 |
| South West | £19,819 |
| North East | £17,782 |
| East Midlands | £16,173 |
| Scotland | £14,642 |
| Yorkshire and The Humber | £14,181 |
| Wales | £12,038 |
| Northern Ireland | £8,421 |
Reference: Finder survey, 2026
Why Might Your Savings Be Above or Below the UK Average?
Assuming people know how much they have in savings, the next question is: is it above or below the UK average? To see what may influence an individual's savings, it is worth looking at the following factors:
Income Level
Adults on lower incomes are more likely to have little or no savings, as much of their earnings go towards essential expenses such as food, housing and utility bills. Analysis by the Joseph Rowntree Foundation of Financial Lives Survey found that 22% of adults with annual incomes below £15,000 had no savings at all. With little money left after covering these necessities, lower-income individuals may struggle to build a financial cushion and could even rely on debt to make ends meet.
Conversely, higher incomes give individuals more disposable income to save after covering essential expenses. However, in some cases, earning more does not automatically translate into having more savings. If spending grows with income through a larger home, lifestyle upgrades or discretionary purchases, an individual may still have little left to save.
Ultimately, savings depend not only on how much a person earns but also on how much they spend and set aside.
Cost of Living
Rent or mortgage payments, childcare, utility bills and student loan repayments can take up a substantial share of monthly income, making it challenging to build savings even for those in full-time employment.
A report by The Guardian highlighted how rising living costs had forced some UK households to stop contributing to their savings and pensions or dip into existing funds to cover everyday expenses. For example, one individual reported that mortgage payments, childcare fees and other living expenses amounted to at least £2,800 a month, leaving little room to save.
Overall, the money left after covering living costs can be as important as income itself, as it determines how much an individual can realistically save.

Saving Habits
How often do you set money aside, and do you save consistently or only when you have money left over? These financial habits can influence how much individuals accumulate over time, as regular saving gradually builds a financial safety net. However, maintaining this routine can be difficult when everyday expenses put pressure on their budget.
Research by Hodge Bank in The Big Savings Squeeze highlights the challenges UK adults face in maintaining their savings. While 41% of surveyed adults said they continued to save regularly, 67% were also using their savings to cover everyday spending, and 34% reported saving less than the previous year. These findings illustrate how saving patterns and the need to draw on existing funds influence what individuals retain.
To sum up, consistent saving and careful money management help individuals build larger savings balances, while irregular saving and frequent withdrawals may limit how much they accumulate over time.
Discover habits hurting your finances with: 10 Money Habits
Average Person’s Savings in the UK: Turning Comparisons Into Progress
Understanding how an individual's savings compare with the UK average offers a useful perspective on their financial position. From average savings per person and household to differences across age groups and regions, these figures show how savings vary based on individual circumstances. Income levels, living costs and financial habits also influence how much people can set aside.
However, the average person's savings in the UK should serve as a reference point rather than a measure of personal financial success. Everyone has different expenses, responsibilities and financial goals.
Therefore, instead of focusing solely on whether their savings are above or below average, individuals can assess whether their savings are sufficient to cover unexpected expenses and support their plans.
Average Savings UK: Frequently Asked Questions
1. How much do most Brits have in savings?
The average cash savings balance among UK adults stands at around £19,214, with older savers pulling the overall average upwards.
2. Is 100k in savings a lot in the UK?
Yes, £100,000 in savings is substantial in the UK, well above the average adult's cash savings of £19,214. However, how far it goes depends on an individual's or household's cost of living and other financial commitments.
3. What is the savings rate in the UK?
Interest rates in the UK reach 8.00% AER for regular savers, 5.00% for easy-access accounts, and 5.37% for long-term fixed bonds.
MyAssets: Keeping Your Savings Organised and Your Financial Wealth in View
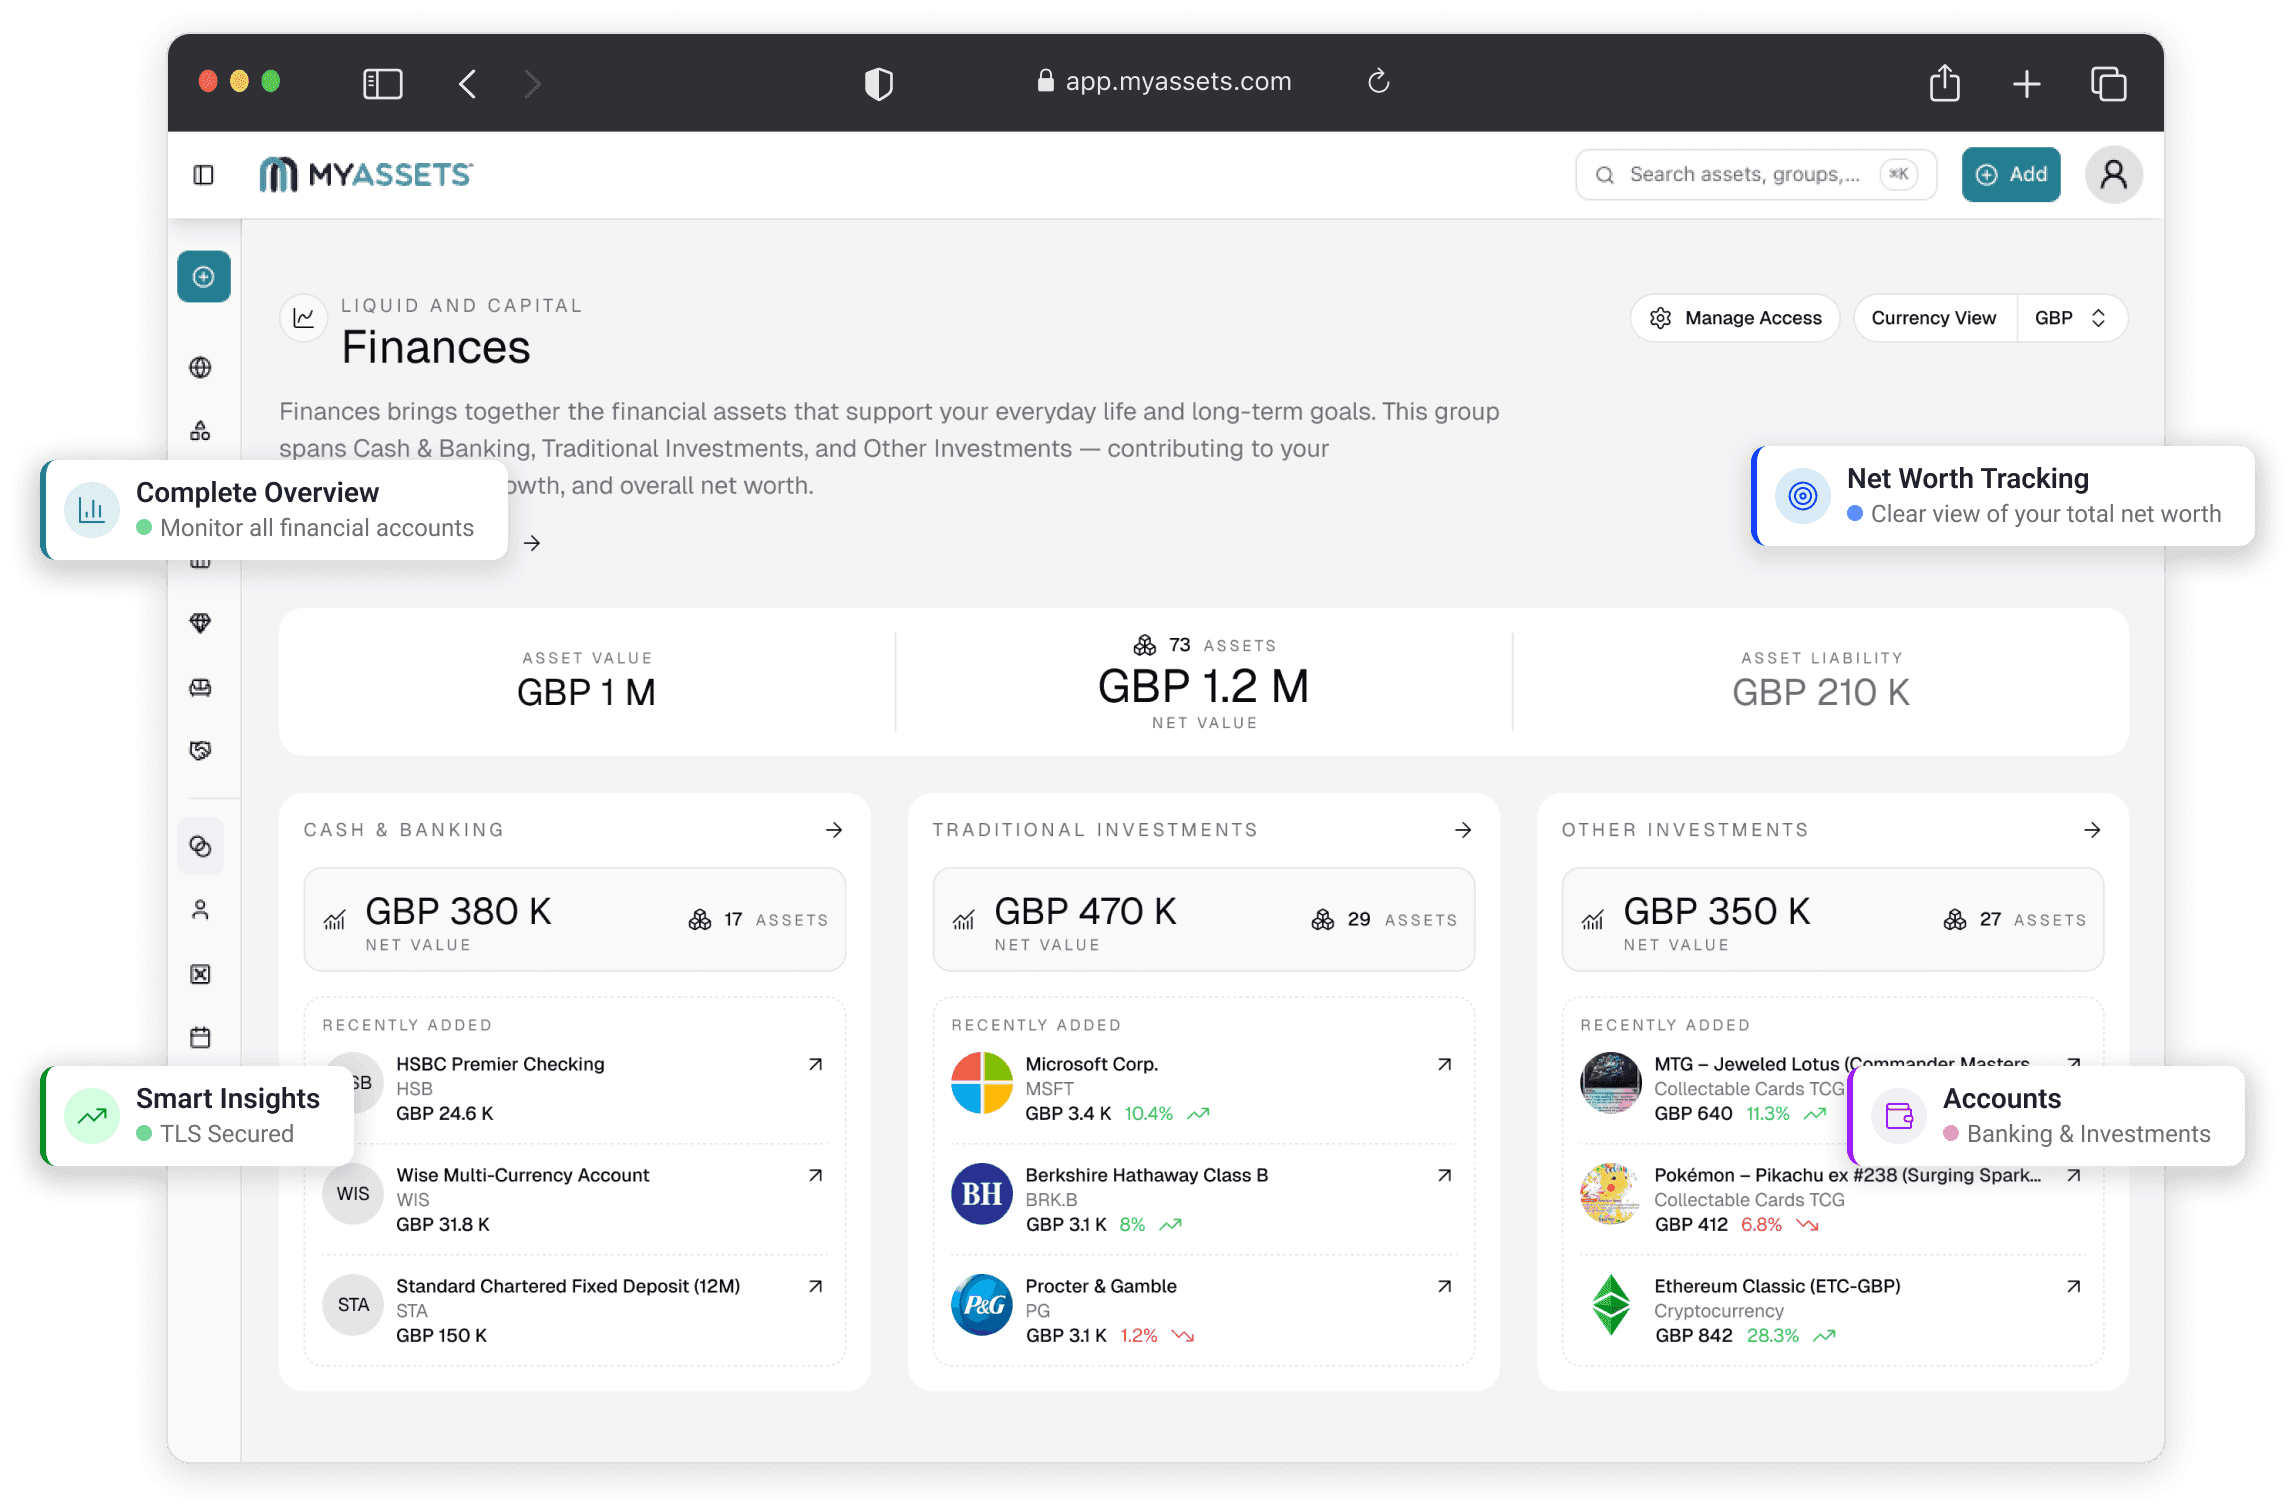
Do you track your savings? Between everyday savings, rainy-day funds, and money set aside for future plans, it is easy to lose sight of how much you have accumulated altogether. MyAssets provides a centralised platform to organise your financial assets, monitor their value, and keep your overall finances in view.
MyAssets helps you understand your finances by providing you with:
- A financial dashboard that summarises your finances by including net value, assets, delegates, and groups.
- A complete record of your savings accounts, detailing account start dates, account numbers, current balances, and other relevant account details.
MyAssets offers practical features to help you streamline finance management, including:
- Connect a Bank Account: link bank accounts to MyAssets through Plaid to sync data, such as account balances.
- Ledger: schedule reminders to deposit a set amount into your savings accounts.
- Groups: organise your accounts into customised categories to manage related accounts.
One Platform for Savings, Investments, and Other Assets
Beyond savings accounts, MyAssets helps you build a more complete picture of your wealth by tracking assets, such as:
- Finances: add your cash and bank accounts, monitor your investments, and track your financial assets.
- Real Estate: view the macro- and micro-level details of your owned and rented real estate, including specific locations, associated assets, liabilities, and net value.
- Collectables: organise, track, and monitor the value of your collection across different collectable types.
- Belongings: track your belongings, such as furniture and appliances, and where they are.
- General Assets: add tangible assets to the platform without sorting them into existing categories.
- Agreements: organise and link loans, mortgages, rental leases, and insurance policies as Agreements on the platform.
Together, MyAssets creates a structured view of everything you own and owe, from the overall portfolio to individual details.
See What MyAssets Can Do for Your Finances. Explore its features and get started for FREE.