
Do you know how much of the world’s wealth the ultra-high-net-worth individuals (UHNWI) control? According to the World Inequality Report 2026, UHNWIs hold three times as much wealth as the world's entire bottom half.
At the very top of the global wealth percentile sits the top 0.001%, an ultra-exclusive group of just 60,000 UHNWI, compared with 2.8 billion in the bottom half. Despite their small numbers, they control 6% of global wealth, while the bottom half shares only 2%.
The disparity is even more striking: the top 10% (556 million adults) captures 53% of all global income, earning more than the remaining 90% (5 billion adults). At the same time, the bottom half of the global population is left to share just 8% of the world's total income.
These figures paint a picture of a world divided, but raise a practical question: what wealth percentile am I in globally?
Labels like “rich” or “ultra-high net worth” mean little without context. Wealth exists along a steep global spectrum shaped by:
- Average Wealth
- Share in Total Income
- Share in Total Wealth
To better understand this spectrum, individuals can also look at global wealth percentiles, which help illustrate how each group, from the bottom 50% to the top 10% and beyond, controls different shares of the world’s assets.
This article explores the tiers of wealth, covering all groups from the global majority to elites, with net worth thresholds for each percentile. To assess your financial position relative to global wealth benchmarks, this article highlights net worth calculator apps that help you determine your net worth and wealth percentile.
- What is a Wealth Percentile?
- Key Metrics Behind Wealth Percentile
- Breakdown of Global Wealth Percentiles: Where Do I Stand?
- Bottom 50%
- Middle 40%
- Top 10%
- Top 1%
- Top 0.1%
- Top 0.01%
- Top 0.001%
- Top 0.0001%
- Top 0.00001%
- Top 0.000001%
- Best Tools to Measure Your Net Wealth Percentile
- How Wealthy Am I?: Understanding Net Worth Levels
- Net Worth Considered Wealthy: Frequently Asked Questions
What is a Wealth Percentile?
A wealth percentile is a statistical measure that ranks an individual’s financial position by comparing their net worth –the value of total assets after subtracting total liabilities –to others within a defined population.
Wealth Distribution by Percentile
Generally, wealth percentiles are grouped into broad wealth tiers that reflect differences in net worth across the global population:
- Bottom 50%: Representing the lower half of the population, this group collectively holds a small share of total global wealth, often with limited assets and, in many cases, higher relative debt levels.
- Top 10%: Includes individuals whose net worth exceeds that of 90% of the population. This tier controls significant global wealth and typically comprises established professionals, business owners, and high-income households.
- Top 1%: Comprises the wealthiest 1% of individuals, whose net worth places them far above the global average. This group holds a disproportionately large share of global assets and often includes high and ultra-high-net-worth individuals.
Key Metrics Behind Wealth Percentile
This raises an important question: how are wealth percentiles evaluated? Beyond simple rankings, they rely on key metrics that offer a clearer view of how financial resources are distributed globally.
Below are the key metrics behind these rankings:
Income
In the report, income is defined as what individuals earn before taxes but after contributions to pensions or retirement plans, known as post-replacement, pre-income tax income. This also covers benefits, such as pensions or unemployment support, showing how social programs help redistribute wealth.
Personal Wealth
Personal wealth is the total value of everything a person owns, including money, stocks, bonds, property, or a business, minus any debts (loans, mortgages, and credit card debt). This indicator gives a complete picture of what a household really has.

Purchasing Power Parity (PPP)
To compare wealth and income fairly across countries, the report uses Purchasing Power Parity (PPP), which adjusts for differences in the cost of living. This ensures that global wealth percentiles reflect real purchasing power, rather than just nominal currency values.
Breakdown of Global Wealth Percentiles: Where Do I Stand?
Drawing on a report conducted by 200 researchers, this article breaks down wealth percentiles globally, highlighting each group’s share of total income, total wealth, and additional measures, such as wealth growth.
1. Bottom 50% (0 - 50th Percentile)
The bottom 50% represents the lower half of the global population. This group, which includes roughly 2.8 billion adults, consists of individuals whose wealth, assets minus liabilities, is the smallest compared to the rest of the world, leaving them with the fewest financial resources.
To understand the realities of the world’s lower half, here is a breakdown of the bottom 50%:
- Population Size: 2.8 billion adults.
- Threshold: Similar to wealth, the income threshold for this group starts at €0.
- Average Wealth: The average wealth per adult in this tier is €6,500 (measured in 2025 PPP). To move out of this tier, an individual would need a net worth of at least €29,200.
- Share of Global Wealth: Although accounting for half the population, this group’s share of global personal wealth remained stagnant at around 2% since the early 2000s.
- Wealth Growth: Between 1995 and 2025, the group’s wealth grew at an average annual rate of 3.4%.
- Average Annual Income: The average income per adult for this group is €5,100.
- Share of Global Income: This group captures 8% of total global income, which is four times higher than their share of total wealth.
- Income Growth: Their income has grown more slowly than their wealth, with an average annual growth rate of 1.8% between 1980 and 2025.
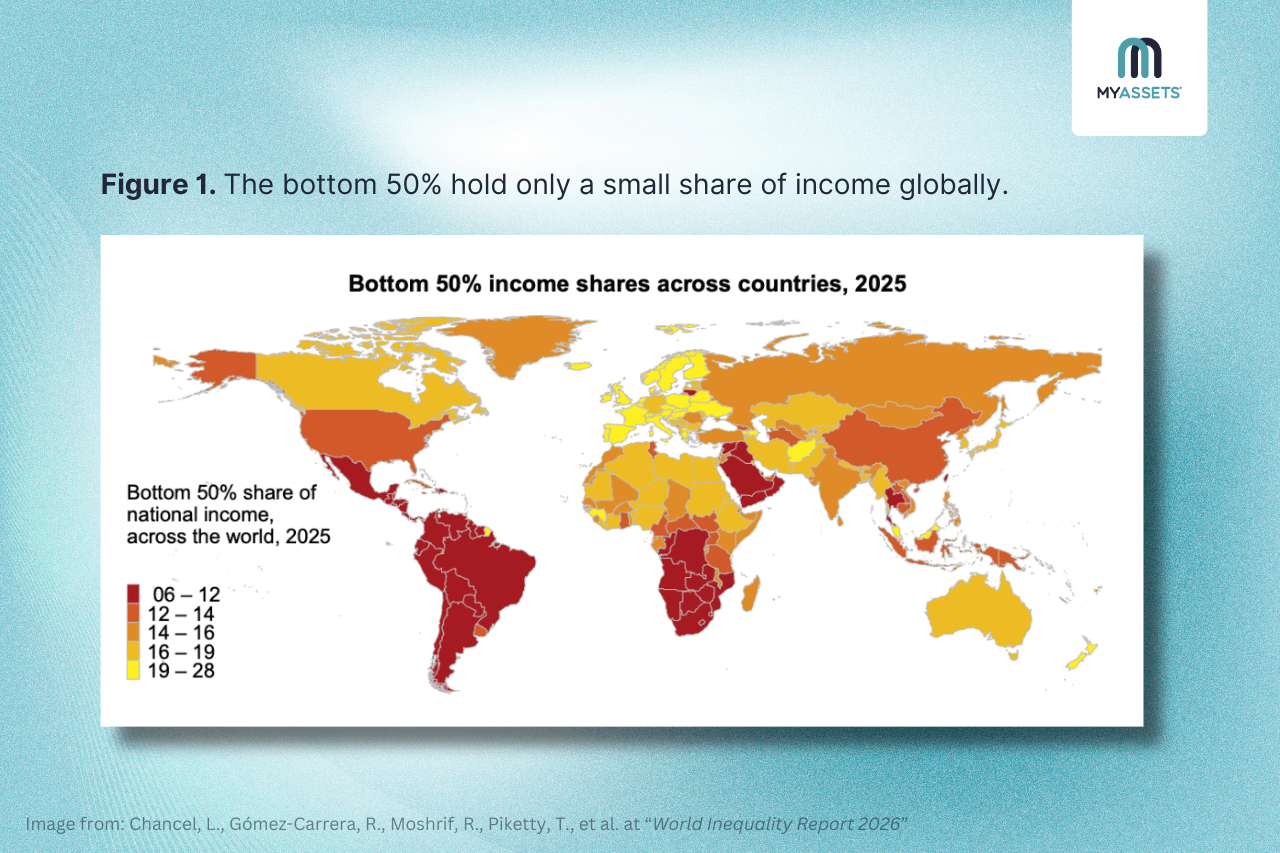
Even though they make up half of the world’s population, the bottom 50% hold just 2% of global wealth and receive a constrained share of national income. It generally falls below 20% in most regions and never exceeds 30% (see figure 1), reflecting structural disadvantage.
As a result, the media organisation Peoples Dispatch notes that many in the bottom 50% are burdened by debt and live hand-to-mouth.
Discover ways to Increase Your Net Worth: 5 Powerful Net Worth Strategies
2. Middle 40% (50th - 90th Percentile)
Above the bottom 50% lies the middle 40%, commonly known as the global middle class. Comprising 2.2 billion adults, this group earns more than the poorest half of the population but remains below the threshold of the economic elite.
Here’s a closer look at the global middle class by wealth and income:
- Population Size: 2.2 billion adults.
- Wealth Threshold (Entry Point): To enter this tier, an individual needs a minimum net worth of €29,200.
- Average Wealth: The average wealth per adult in this group is €91,700 (2025 PPP).
- Share of Global Wealth: This group owns 24% of the world's total assets.
- This group has seen steady financial progress, with a 3.5% annual wealth growth rate since 1995 and a 1% annual income growth rate since 1980.
- Income Threshold (Entry Point): The minimum annual income required to be in this group is €11,500.
- Average Annual Income: The average income for an adult in this tier is €29,100.
- Share of Global Income: They capture 39% of the world's total income.
- Regional note: In Europe, as well as parts of North America and Oceania, the middle 40% accounts for 44-50% of national income, highlighting their role in national income distribution.
Distribution of Wealth Worldwide: Where the Middle Class Thrives
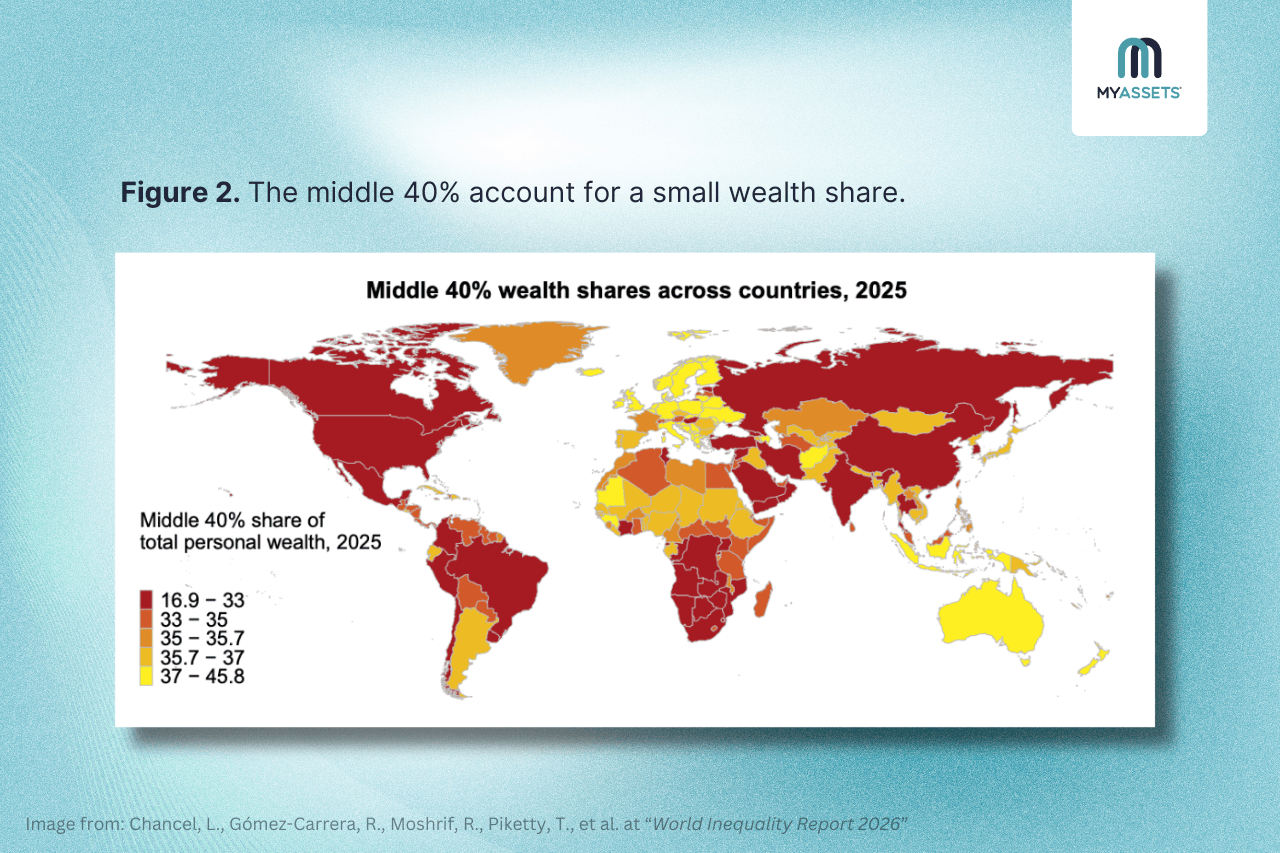
On average, the middle 40% controls 24% of global wealth, but this share differs widely across countries. Figure 2 highlights the distinct bands reflecting the strength of middle-class wealth worldwide.
- 16.9% - 33% Range: This lower band includes countries like Colombia, where the middle 40% owns just 27% of wealth, well below their share of the population.
- 33% - 35% Range: This middle-tier band represents a more balanced distribution, often found in developing economies with a growing middle-income segment.
- 37% - 45.8% Range: This is the highest band, clustered primarily in Europe and Oceania. In these regions, the middle 40% commands a sizeable portion of net worth, such as Norway at 43.9%, which is broadly in line with their population weight.
Ultimately, the middle 40% includes both ends, particularly those in thriving economies like Europe and Oceania, where they hold a sizable share of wealth, and countries such as Colombia, where their income and wealth remain relatively limited. Together, they illustrate the global middle class: substantial in number and varied in resources.
3. Top 10% (90th - 100th Percentile)
The top 10% represents the wealthiest segment of the global population, positioned above the middle 40% but below the ultra-wealthy top 1%.
Strikingly, these 556 million high-net-wealth (HNW) individuals hold a disproportionately large share of global wealth compared to the rest of the world, and here’s what that looks like in detail:
- Population Size: 556 million adults.
- Wealth Threshold (Entry Point): To enter the top 10%, an individual needs a minimum net worth of €265,600.
- Average Net Worth: Adults in this tier have an average wealth of €1 million, classifying them as high-net-worth individuals.
- Share of Global Wealth: They control 74% wealth –nearly three-quarters of all global assets.
- Regional Note: The top 10% hold no less than 45% of total wealth globally, with some nations seeing their share soar to 86%, showing an extraordinary concentration for just one in ten people.
- Income Threshold (Entry Point): The minimum annual income required to be in this group is €65,500 (around €5,460 per month).
- Average Annual Income: Adults in this tier earn an average of €159,300 per year (€13,275 per month), which is thirty-one times as much as the income of the bottom 50% of adults, who live on less than €500 per month.
- Share of Global Income: They capture 53% of the world's total income, while the bottom half of the population receives only 8%.
Overall, no country sees the top 10% earning less than 26% of total income. Even where inequality is relatively low, this group still receives more than a quarter of all income (see figure 3).
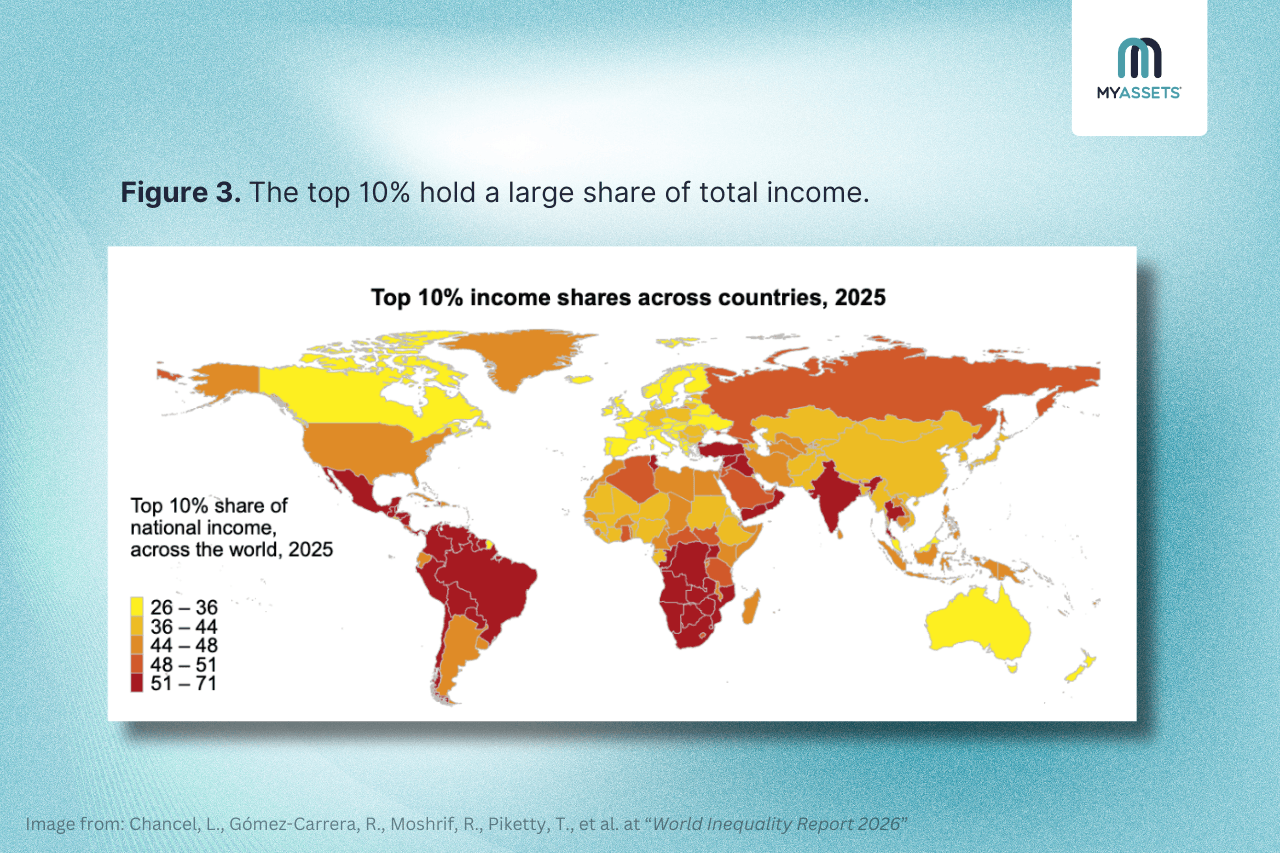
However, wealth inequality is even more pronounced. Across the globe, the top 10% controls well over half of total wealth, while the bottom half holds only a small fraction. This stark imbalance underscores how economic power is concentrated at the very top, shaping both national and global financial landscapes.
4. Top 1% (99th - 100th Percentile)
At the very top of the global wealth pyramid is the top 1%, an elite group of 56 million adults, which is about the same number as the population of the United Kingdom (UK).
Despite being such a small group, they control as much wealth as all the adults in China, India, the United States (US), Indonesia, Nigeria, Brazil, and Russia combined, showing how a tiny fraction of people hold the majority of global wealth.
This raises an important question: how much wealth do the top 1% hold? Here’s a complete breakdown of this top 1% wealth bracket:
- Population Size: 56 million adults.
- Wealth Threshold (Entry Point): To be considered part of the global top 1%, an individual must have a minimum net worth of €2 million (2025 PPP).
- Average Wealth: The average wealth per adult in this tier is €6 million.
- Share of Global Wealth: The top 1% controls 37% of the world's total wealth.
- Regional Insight: Across regions, the top 1% holds 25% of wealth in Europe, around a third in North America & Oceania (34%) and South & Southeast Asia (35%), 36% in Sub-Saharan Africa and Latin America, 37% in the Middle East & North Africa, and 46% in Russia & Central Asia.
- Income Threshold: The minimum annual income required to enter this tier is €250,300.
- Average Annual Income: The average income for an adult in the top 1% is €612,100.
- Share of Global Income: This group captures 20% of total global income.
- Side note: Meaning, 56 million people earn 2.5 times more than the 2.8 billion adults of the bottom 50% (See figure 4).
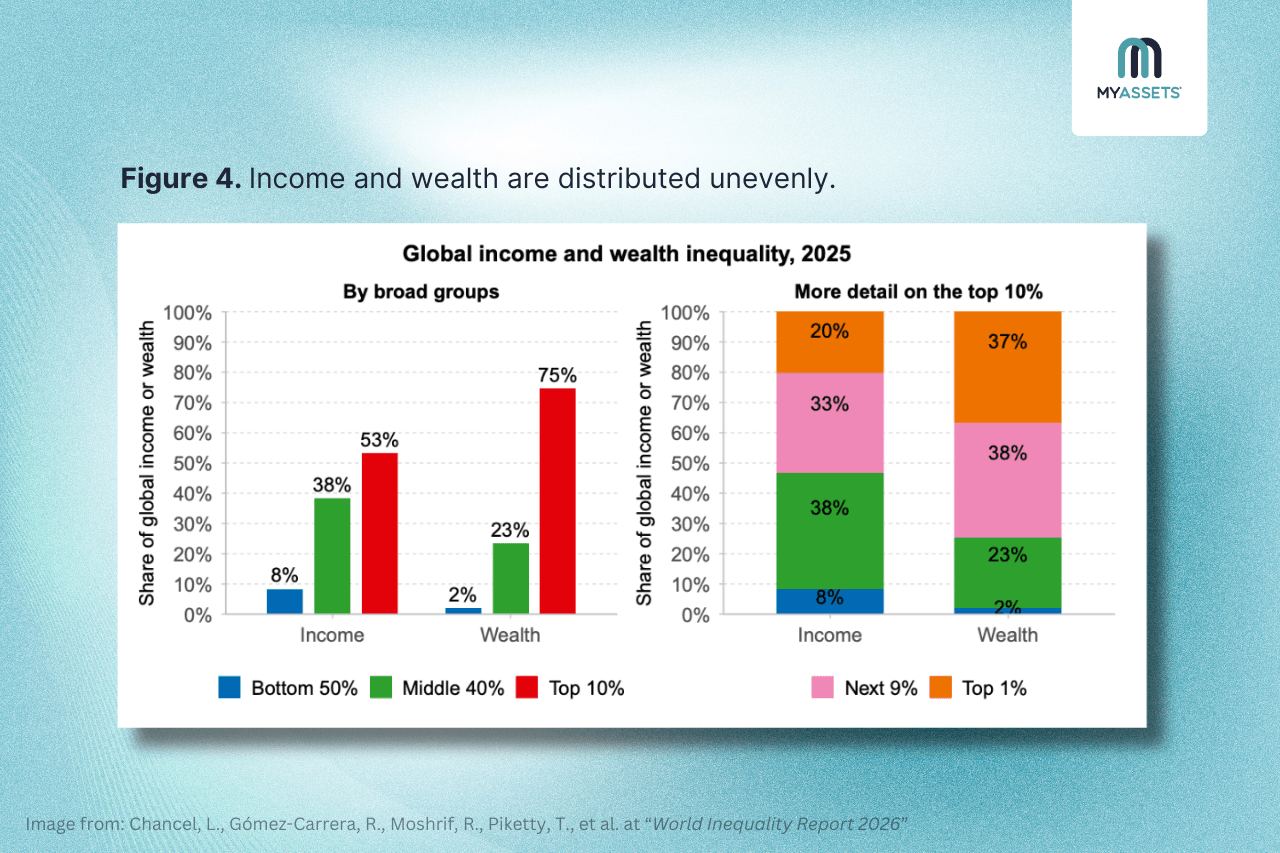
To summarise, this elite circle of 56 million adults owns eighteen times more (37%) than the mere 2% shared by the 2.8 billion people. Notably, in places like Latin America, the Middle East, and Russia, the top 1% holds more wealth than the bottom 90% of the population combined, showing just how uneven global wealth can be.
5. Top 0.1% (99.9th - 100th Percentile)
Moving into the most exclusive levels of the global elite, the top 0.1% represents an extraordinary concentration of wealth below the billionaire class. This group includes about 5.6 million adults, roughly the same as the population of Singapore.
To find out their share in the global wealth distribution, here’s a breakdown:
- Population Size: 5.6 million adults.
- Wealth Threshold (Entry Point): To enter this tier, an individual must have a minimum net worth of €7 million (2025 PPP).
- Average Wealth: The average wealth per adult in this tier is €30 million.
- Share of Global Wealth: This tiny segment commands a staggering 19% of global wealth, holding nearly as much as the entire Middle 40% (with 24% of global wealth share).
- Income Threshold (Entry Point): The minimum annual income required for this tier is €914,300.
- Average Income: On average, an adult in the top 0.1% earns €2.5 million.
- Share of Global Income: This group captures 8% of total global income.
- Income Growth Rate: This group's income has grown by 2% annually, outpacing the growth of both the top 1% (1.6%) and the top 10% (1.2%).
In summary, the top 0.1%, a group no larger than Singapore’s population, earns as much as the entire bottom half of the world’s population (See figure 5). Both groups control 8% of total global income, showing that as few as 5.6 million people have the same income share as 2.8 billion adults.
Figure 5. Global income distribution and progression.
| Group | Adult Population (2025) | Share in Total Income ( % )(2025) | Avg. Income Per Adult (2025 PPP €) | Threshold (2025 PPP €) | Avg. Annual Growth Rate (1980-2025) |
|---|---|---|---|---|---|
| Full Population | 5.6 billion | 100% | 30,100 | 0 | 1.1% |
| Bottom 50% | 2.8 billion | 8% | 5,100 | 0 | 1.8% |
| Middle 40% | 2.2 billion | 39% | 29,100 | 11,500 | 1% |
| Top 10% | 556 million | 53% | 159,300 | 65,500 | 1.2% |
| Top 1% | 56 million | 20% | 612,100 | 250,300 | 1.6% |
| Top 0.1% | 5.6 million | 8% | 2.5 million | 914,300 | 2% |
| Top 0.01% | 556,000 | 4% | 11.4 million | 3.7 million | 2.5% |
| Top 0.001% | 56,000 | 2% | 51.2 million | 17.7 million | 2.7% |
| Top 0.0001% | 5,600 | 1% | 248.1 million | 73.6 million | 3% |
Source: World Inequality Report 2026
6. Top 0.01% (99.99th - 100th Percentile)
The top 0.01% consists of 556,000 individuals, a group roughly equal to the population of Genoa, Italy.
While small in number, these individuals possess a level of financial power that is almost difficult to fathom when compared to the global average. Here’s a closer look:
- Population Size: 556,000 adults.
- Wealth Threshold (Entry Point): To be part of this group, an individual must have a minimum net worth of €38 million (2025 PPP).
- Average Wealth: The average wealth per adult in this tier is a staggering €173 million.
- Share of Global Wealth: With an 11% share, these 556,000 people own 5.5 times more wealth than the entire Bottom 50% of humanity (2.8 billion people), who share just 2%.
- Income Threshold (Entry Point): Entering this bracket requires a minimum income of €3.7 million.
- Average Income: On average, an adult in the top 0.01% earns €11.4 million.
- Share of Global Income: This group captures 4% of the world's total income.
- Income Growth: Income in this tier has increased by 2.5% per year, far faster than the 1% annual growth seen by the bottom 50%.
In summary, the top 0.01% hold an average wealth of €173 million, far exceeding the €38 million threshold to enter this tier. Although few in number, this group holds 11% of global wealth –more than five times the share of the bottom 50%, who have only 2%.
7. Top 0.001% (99.999th Percentile)
The top 0.001% represents the peak of global wealth concentration, consisting of 56,000 adults who could all fit inside a single football stadium.
While the entry threshold to join this percentile is €254 million, the average wealth within the group is a staggering €986 million, placing the average member on the doorstep of billionaire status.
Below is the economic profile of the top 0.001%:
- Population Size: This ultra-exclusive group consists of only 56,000 adults.
- Wealth Threshold (Entry Point): Joining this tier requires a net worth of at least €254 million.
- Average Wealth: The average wealth in this group reaches a staggering €986 million, bringing the typical member close to becoming a billionaire.
- Share of Global Wealth: They own 6% of all global wealth, which is three times more than the share held by the entire bottom half of the world’s population.
- Side Insight: In other words, fewer than 60,000 individuals control three times the wealth of 2.8 billion people combined.
- Income Threshold (Entry Point): The top 0.001% begins at an annual income threshold of €17.7 million.
- Average Income: Elites in the top 0.001% earn an average of €51.2 million.
- Share of Global Income: This group accounts for 2% of the world’s total income.
All in all, the 56,000 adults in the top 0.001% possess an average wealth of €986 million, owning 6% of global wealth (triple the share held by the bottom 50% combined).
However, their dominance is largely driven by accumulated wealth rather than income, as they hold a much larger share of global wealth (6%) compared to their relatively small share of income (2%). This suggests that their influence comes mainly from long-term asset ownership rather than earnings, reinforcing their lasting role in the global economy.
8. Top 0.0001% (99.9999th Percentile)
The wealth level of billionaires begins with the top 0.0001% (top 1/1 million), representing the richest slice of the global population, consisting of just 5,600 adults. This tier includes well-known figures such as Sam Altman, the CEO of OpenAI, with a net worth of approximately $3.5 billion (€2.97 billion), and global superstar Taylor Swift, with $2 billion (€1.7 billion).
As the report highlights, these billionaires, small enough to fill a concert arena, hold a disproportionate share of global wealth, far exceeding that of the vast majority of the world’s population.
Here’s a breakdown of their wealth and income to illustrate the scale of their financial dominance.
- Population Size: 5,600 adults globally.
- Wealth Threshold (Entry Point): To be part of this group, an individual must have a minimum net worth of €1 billion.
- Average Wealth: The average wealth per adult in this tier is a staggering €5 billion.
- Share of Global Wealth: These 5,600 individuals control 3% of all personal wealth on Earth.
- Side Insight: To put it in perspective, this tiny group of billionaires owns 1.5 times as much as the 2.8 billion people in the bottom 50%, who share only 2%.
- Income Threshold (Entry Point): Entering this wealth bracket requires a minimum income of €73.6 million.
- Average Income: On average, an adult in the top 0.0001% earns €248.1 million per year, which is more than €20 million per month.
- By comparison, half of the global adult population lives on less than €500 per month, the top 10% earn thirty-one times that, and the ultra-elite make almost fifty thousand times more.
- Share of Global Income: This group captures 1% of the world's total annual income.
Ultimately, the top 0.0001% represents wealth mainly built and grown through assets rather than earned from work. While some billionaires are technically self-made, the economic power of this group is increasingly driven by assets rather than effort.
How so? Their 3% wealth share is triple their 1% income share, proving that their dominance is sustained by the growth of existing holdings, which have grown at 5.3% annually since 1995, rather than new annual earnings (See figure 6).
Essentially, at this level, money no longer just makes money; it scales at a rate that far outpaces the rest of the global economy.
Figure 6. Global wealth allocation and growth.
| Group | Adult Population (2025) | Share in Total Wealth ( % )(2025) | Avg. Wealth Per Adult (2025 PPP €) | Threshold (2025 PPP €) | Avg. Annual Growth Rate (1980-2025) |
|---|---|---|---|---|---|
| Full Population | 5.6 billion | 100% | 155,500 | 0 | 3.1% |
| Bottom 50% | 2.8 billion | 2% | 6,500 | 0 | 3.4% |
| Middle 40% | 2.2 billion | 24% | 91,700 | 29,200 | 3.5% |
| Top 10% | 556 million | 74% | 1 million | 265,600 | 2.9% |
| Top 1% | 56 million | 37% | 6 million | 2 million | 3.1% |
| Top 0.1% | 5.6 million | 19% | 30 million | 7 million | 3.8% |
| Top 0.01% | 556,000 | 11% | 173 million | 38 million | 4.5% |
| Top 0.001% | 56,000 | 6% | 986 million | 254 million | 4.9% |
| Top 0.0001% | 5,600 | 3% | 5 billion | 1 billion | 5.3% |
| Top 0.00001% | 560 | 0.8% | 12 billion | 4 billion | 8.4% |
| Top 0.000001% | 56 | 0.3% | 53 billion | 22 billion | 8.5% |
Source: World Inequality Report 2026
9. Top 0.00001% (99.99999th Percentile)
The next tier is the top 0.00001% (top 1/10 million), representing the inner circle of the world’s billionaires, comprising just 560 individuals. Among them is Harold Hamm & family, founder of one of the largest independent oil companies in the US, with a net worth of $16 billion (€13.5 billion).
Explore the wealth and influence of the world’s top 0.00001%:
- Population Size: 560 adults that would fill a theatre.
- Wealth Threshold (Entry Point): Joining this rank would require a minimum of €4 billion in net wealth.
- Average Wealth: The average wealth per adult in this wealth bracket is €12 billion.
- Share of Global Wealth: This tiny group of elites control 0.8% of global wealth.
- Side Insight: For context, this group of 560 individuals possess nearly half the wealth of the bottom 2.8 billion people, who together hold just 2%.
Ultimately, the top 0.00001% represents the most concentrated layer of the global wealth pyramid. Despite numbering only 560 people, their collective fortunes illustrate how economic power at the highest level can rival that of vast populations.
10. Top 0.000001% (99.999999th Percentile)
When people search for the richest individuals in the world, they are often looking at those in the top 0.000001% (top 1/100 million) of the global population. This ultra-exclusive group includes figures, such as Elon Musk, Mark Zuckerberg, and Jeff Bezos, whose fortunes reach hundreds of billions of dollars.
Beyond recognising these billionaires, the next question emerges: how concentrated is wealth at this level?
Here’s a breakdown of the global wealth distribution within the top 0.000001%.
- Population Size: Consists of 56 adults worldwide, a number small enough to fit inside a single classroom.
- The numbers drop sharply, from 56 million in the top 1% to only 56 individuals in the top 0.000001% (1 in 100 million).
- Wealth Threshold (Entry Point): To belong to this bracket, an individual must have a minimum net worth of €22 billion.
- Average Wealth: The average wealth per adult in this tier is a staggering €53 billion.
- Share of Global Wealth: These 56 individuals control 0.3% of all personal wealth worldwide.
The most striking finding of the World Inequality Report 2026 is that wealth growth has been steepest at the very tip of the distribution, that is, the Top 0.000001%. Since 1995, the fortunes of these 56 individuals have grown by 9% annually, nearly triple the rate of the average global adult (see figure 7).
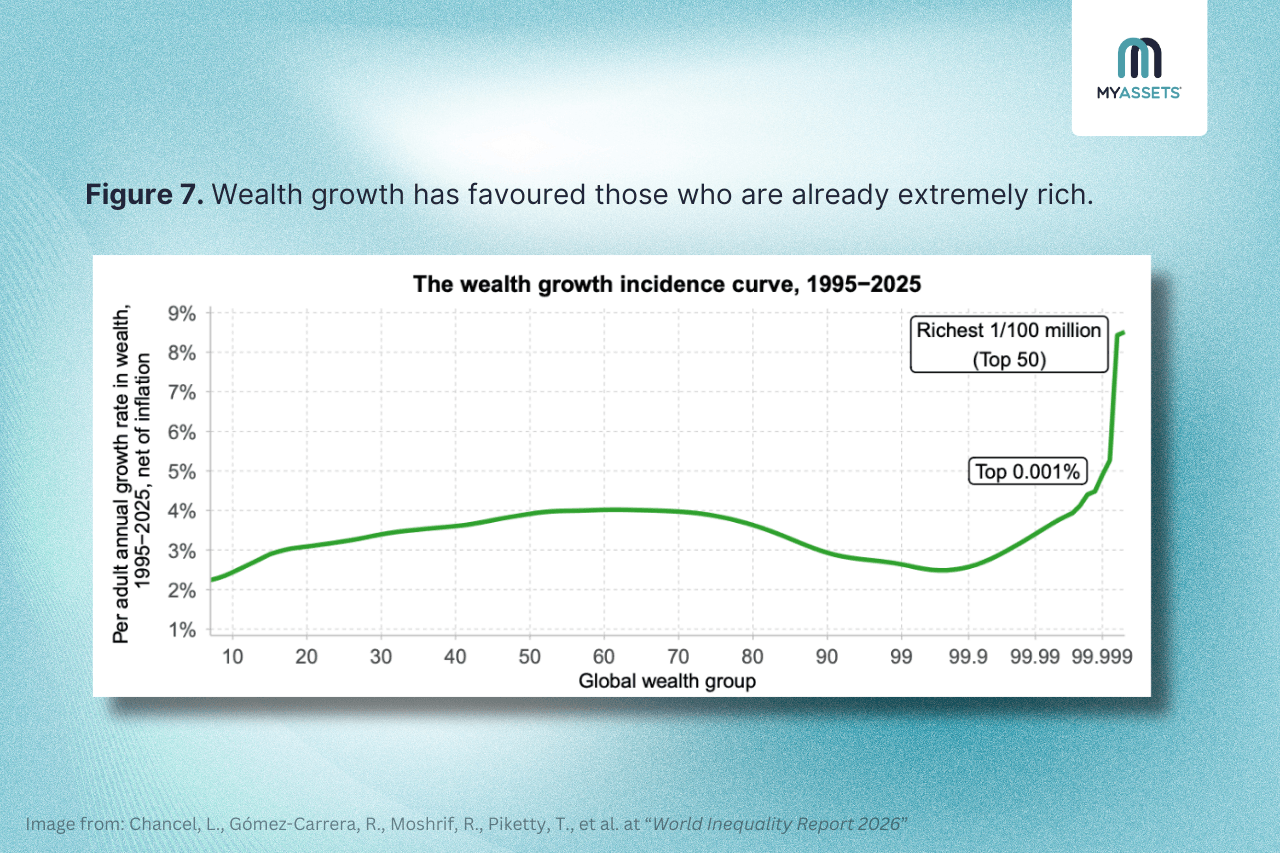
In essence, at the top 0.000001%, wealth isn’t just money; it’s a self-growing powerhouse. This group of billionaires’ fortunes grow faster and faster, leaving the rest of the world far behind.
Best Tools to Measure Your Net Wealth Percentile
Curious about your wealth percentile? Here are the best tools to measure how your net worth compares globally.
Net Worth Tracking App
A net worth tracking app serves as a centralised dashboard that aggregates an individual’s entire financial portfolio, from cash and bank accounts to properties and investments, while accounting for liabilities such as loans and mortgages.
While these apps do not typically calculate and display one’s wealth percentile directly, they provide the accurate, real-time net worth figure necessary to consult global wealth data. By monitoring wealth and maintaining an up-to-date calculation, users can determine where they stand within the global wealth percentiles.
Here are some notable net wealth calculators worth exploring:
- Boldin
- Empower
- MyAssets
Wealth Percentile Calculator
A wealth percentile calculator is a specialised tool that helps individuals or households understand their position within the global or national wealth distribution. By inputting data such as total net worth or annual income, the calculator compares these figures against a given population to calculate wealth percentile.
Listed below are recommended global wealth percentile calculators:
- Agni Folio - Net Worth Ranking Finder
- FinancialAha - Net Worth Percentile Calculator
- Giving What We Can - How Rich Am I Calculator
How Wealthy Am I?: Understanding Net Worth Levels
As the World Inequality Lab’s World Inequality Report 2026 shows, the gap between the ultra-wealthy and the rest of the world continues to widen.
A striking example is the top 0.001%, which consists of 60,000 people. Despite their small numbers, they hold three times as much wealth as the 2.8 billion adults (bottom 50%), who together own only 2% of global wealth.
This extreme concentration becomes clearer when looking at the wealth thresholds required to enter each tier. To illustrate where the entry points are for the most exclusive tiers, the World Inequality Report provided an approximate threshold per adult:
- Bottom 50%: €0 ($0) – The bottom half of humanity
- Middle 40%: €29,200 ($33,621) – The global middle class
- Top 10%: €265,600 ($305,815) – The global upper-middle class
- Top 1%: €2 million ($2.3 million) – The millionaire entry bracket
- Top 0.1%: €7 million ($8.1 million) – The high-net worth individual
- Top 0.01%: €38 million ($43.8 million) – The ultra-high net worth individuals' entry bracket
- Top 0.001%: €254 million ($292.5 million) – The 60,000 ultra-wealthy group
- Top 0.0001%: €1 billion ($1.2 billion) – The official entry point for global billionaires
- Top 0.00001%: €4 billion ($4.6 billion) – The world's wealthiest 500 individuals
- Top 0.000001%: €22 billion ($25.3 billion) – The ultra-exclusive tier of the world's top 50
For individuals curious about their financial standing, tools such as wealth tracking apps and global wealth percentile calculators can help estimate their net worth and compare it with global benchmarks.
Beyond personal curiosity, however, these metrics serve a much larger purpose. By mapping wealth across 5.6 billion adults worldwide, wealth percentiles help explain how resources, opportunities, and economic influence are distributed globally.
Net Worth Considered Wealthy: Frequently Asked Questions
1. What is the 99th percentile wealth in the UK?
In the United Kingdom, reaching the 99th percentile of wealth generally requires a net worth of roughly £3-4 million ($4-5 million) per adult, depending on the dataset and year.
2. What is considered a wealthy retiree?
While thresholds vary by country, a retirement net worth of $1-2 million or more typically signifies financial comfort and wealth.
3. What is considered upper middle class net worth?
An upper-middle-class net worth typically falls within the top 10% of global wealth, which is around €265,600 ($305,815) per adult.
MyAssets: Your All-in-One Net Worth Tracker
Knowing where one fits in the global wealth percentile is one thing; having the data to prove it is another.
While the numbers from the World Inequality Report are staggering, they remain abstract until applied to an individual’s own balance sheet. After all, no one can realistically aim for the “stadium” of the top 0.001% without first knowing exactly where they stand.
This is where a net worth tracking tool like MyAssets becomes essential.
Designed to organise, track, and manage assets, MyAssets gives users a full 360-degree view of their wealth by consolidating information from all accounts in one place.
A Single Dashboard to Measure Wealth
It pulls in everything —from bank accounts (checking and savings), investment portfolios (stocks, bonds, and mutual funds), and properties (residential, rental, and commercial), to valuable assets like collectable investments (art, wine, watches, etc.).
It gets better. MyAssets doesn’t just show one’s assets; it also incorporates their liabilities, such as:
- Credit card debts
- Loans
- Mortgages
Imagine having all this information presented in a visually appealing dashboard. With MyAssets, monitoring net worth becomes straightforward as the platform transforms raw numbers into dynamic charts. It offers a breakdown of resources across finances, properties, collectables, and even belongings, making it easier to understand overall wealth.
A System to Manage Relationships Between Assets
Even better, users can manage relationships between assets with its Smart Asset Linking feature. In practice, this means users can connect related items, like the first bought home with its mortgage or the belongings it houses. This helps understand how assets relate to one another and their impact on one’s net worth and portfolio.
Track all your assets and see your true wealth with MyAssets, free for 14 days.