
Do you know how much wealth the top 1 per cent have compared to the rest of the world? As noted by the World Inequality Report 2026, the top 1% controls more wealth than the bottom 90% combined. This means that the top 1%, comprising roughly 56 million adults, collectively owns more wealth than the remaining 90% of the global population, which is over 5 billion adults.
However, this imbalance becomes even more pronounced when looking within the top 1% itself. The net worth of the top 1% is merely the entry point into the global wealth elite, and within it lie even more concentrated wealth tiers: the top 0.1%, 0.01%, and beyond.
As one moves up each level, wealth becomes increasingly concentrated relative to population size, proving that it is indeed a layered structure of inequality, where a very small elite holds most of the wealth.
This now raises a key question: how much wealth is needed to be in the top 1 per cent?
While Elon Musk's net worth of $789.9 billion is often seen as a benchmark of extreme wealth, it far exceeds the actual entry point into the top 1%. In reality, the net worth needed to be in the top 1 per cent is lower than that of billionaires.
To understand the wealth of the top 1 per cent, this article breaks down wealth levels among rich rich people, from the entry point to the top 0.000001%, covering net worth thresholds, average wealth, and share of global wealth.
- What Does Being in the Top 1% Mean?
- Inside the top 1%: Wealth Percentile Breakdown
- Wealth of the Top 1 Per cent in the World: Numbers Revealed
- Net Worth of the Top 1 Per cent: Frequently Asked Questions
What Does Being in the Top 1% Mean?
Firstly, the top 1% is a percentile which shows how someone ranks compared to everyone else in a group.
In the context of wealth, being in the top 1% means having a net worth (total assets minus liabilities) that is higher than that of 99% of the population. This places an individual at the very top of the wealth distribution, where only a very small share of people hold more wealth, and everyone else falls below this level.
However, when asking how much net worth to be in the top 1%, the answer depends on whether it is measured globally or within a specific country.
On a global scale, the threshold is lower than many people expect due to significant wealth disparities and extreme poverty in many regions. To learn more, the following section outlines the wealth threshold of the richest 1 per cent in the world.
Inside the top 1%: Wealth Percentile Breakdown
While often treated as a single category, the top 1% consists of multiple layers of wealth, each with very different levels of concentration. To understand how much wealth do the 1 per cent own, this article breaks down these tiers and how wealth is distributed within them.
1. Top 1% (99th - 100th Percentile)
The top 1% occupies the peak of the global wealth pyramid, comprising about 56 million adults, a figure comparable to the United Kingdom’s (UK) population.
While representing only a tiny fraction of the population, they control as much wealth as the combined adult populations of China, India, the United States, Indonesia, Nigeria, Brazil, and Russia, illustrating the depth of global wealth inequality.
So, how much wealth is owned by the 1 per cent? Here’s an overview of the key data points that define this group:
Net Worth of the Top 1 Per cent
- Wealth Threshold (Entry Point): The minimum net worth of top 1 per cent is €2 million (2025 PPP)
- Average Wealth: The top 1 per cent's average wealth is €6 million
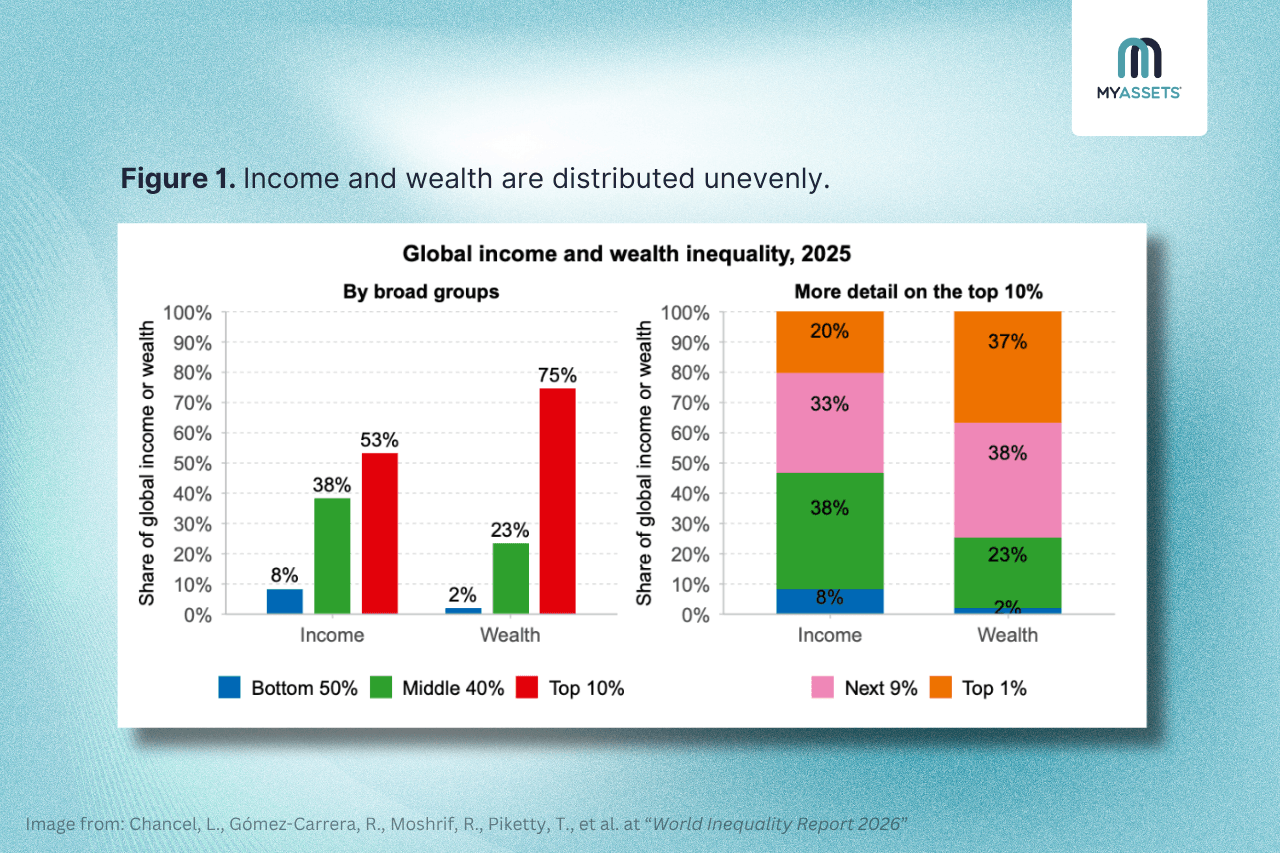
- Share of Global Wealth: The top 1% controls 37% of the world's total wealth
- Side Note: Meaning, the 56 million richest 1 per cent in the world controls 37% of global wealth –nearly eighteen times the amount shared by the world’s poorest 2.8 billion people. In regions like Latin America, the Middle East, and Russia, the top 1% holds more wealth than the bottom 90% combined.
Top 1 Per cent Income
- Income Threshold: The minimum income required for the top 1 per cent is €250,300 annually
- Average Annual Income: The average income for an adult in the top 1% is €612,100
- Share of Global Income: This group captures 20% of total global income
- Side Note: In other words, 56 million people generate 2.5 times (20%) more income than the 2.8 billion adults (8%) in the lowest half of the population (See figure 1)
Learn More: 5 Powerful Strategies to Increase Your Net Worth
2. Top 0.1% (99.9th - 100th Percentile)
Within the most exclusive tiers of global wealth, the top 0.1% highlights an even higher concentration of wealth just below billionaire levels. This group of approximately 5.6 million adults is roughly equivalent to Singapore’s population.
To see the top 0.1% richest people in the world, here’s a breakdown of their share in wealth and income:
Top 0.1% Net Worth
- Wealth Threshold (Entry Point): A minimum net worth of €7 million (2025 PPP)
- Average Wealth: €30 million per adult
- Share of Global Wealth: This group commands about 19% of global wealth, close to the Middle 40%’s combined share of 24%
Top 0.1% Income
- Income Threshold (Entry Point): The minimum annual income for this tier is €914,300
- Average Income: On average, an adult in the top 0.1% earns €2.5 million
- Share of Global Income: This group captures 8% of total global income
- Side Note: Shows that a Singapore-sized group earns as much as half of the world’s population (See figure 2)
Figure 2. Global income distribution and progression.
| Group | Adult Population (2025) | Share in Total Income ( % )(2025) | Avg. Income Per Adult (2025 PPP €) | Threshold (2025 PPP €) | Avg. Annual Growth Rate (1980-2025) |
|---|---|---|---|---|---|
| Full Population | 5.6 billion | 100% | 30,100 | 0 | 1.1% |
| Bottom 50% | 2.8 billion | 8% | 5,100 | 0 | 1.8% |
| Middle 40% | 2.2 billion | 39% | 29,100 | 11,500 | 1% |
| Top 10% | 556 million | 53% | 159,300 | 65,500 | 1.2% |
| Top 1% | 56 million | 20% | 612,100 | 250,300 | 1.6% |
| Top 0.1% | 5.6 million | 8% | 2.5 million | 914,300 | 2% |
| Top 0.01% | 556,000 | 4% | 11.4 million | 3.7 million | 2.5% |
| Top 0.001% | 56,000 | 2% | 51.2 million | 17.7 million | 2.7% |
| Top 0.0001% | 5,600 | 1% | 248.1 million | 73.6 million | 3% |
Source: World Inequality Report 2026
3. Top 0.01% (99.99th - 100th Percentile)
The top 0.01% includes approximately 556,000 individuals, a figure comparable to Genoa, Italy’s population.
Even though ultra-high net worth individuals (UHNWIs) are few, their financial power is nearly impossible to comprehend when compared to global averages. Here’s a closer look:
Net Worth of Top 0.01%
- Wealth Threshold (Entry Point): A minimum net worth of €38 million (2025 PPP)
- Average Wealth: €173 million per adult, which is nearly five times higher than the entry point
- Share of Global Wealth: At 11% of global wealth, this group of 556,000 owns 5.5 times the wealth of the Bottom 50% (2.8 billion people), who collectively share only 2%
Income of Top 0.01%
- Income Threshold (Entry Point): Entering this bracket requires a minimum income of €3.7 million
- Average Income: On average, an adult in the top 0.01% earns €11.4 million
- Share of Global Income: This group captures 4% of the world's total income
- Income Growth: This group has seen income rise at 2.5% annually, compared to just 1% growth for the bottom 50%
4. Top 0.001% (99.999th Percentile)
Wealth concentration becomes even more extreme at the top 0.001%, a group of around 56,000 adults –small enough to fit inside a single football stadium.
Net worth entry begins at €254 million, but individuals in this group average €986 million in wealth, positioning them just below billionaire status.
The following outlines the economic profile of one of the wealthiest people in the world:
Top 0.001% Net Worth
- Wealth Threshold (Entry Point): Requires a net worth of at least €254 million
- Average Wealth: With an average wealth of €986 million, members of this group are nearing billionaire levels
- Share of Global Wealth: Owns 6% of all global wealth, which is three times more than the share held by the entire bottom half of the world’s population (See figure 3)
- Side Insight: This shows that fewer than 60,000 individuals possess three times the wealth of 2.8 billion people combined
Top 0.001% Income
- Income Threshold (Entry Point): Starts at an annual income threshold of €17.7 million
- Average Income: Earns an average of €51.2 million
- Share of Global Income: Accounts for 2% of the world’s total income
Figure 3. Global wealth allocation and growth.
| Group | Adult Population (2025) | Share in Total Wealth ( % )(2025) | Avg. Wealth Per Adult (2025 PPP €) | Threshold (2025 PPP €) | Avg. Annual Growth Rate (1980-2025) |
|---|---|---|---|---|---|
| Full Population | 5.6 billion | 100% | 155,500 | 0 | 3.1% |
| Bottom 50% | 2.8 billion | 2% | 6,500 | 0 | 3.4% |
| Middle 40% | 2.2 billion | 24% | 91,700 | 29,200 | 3.5% |
| Top 10% | 556 million | 74% | 1 million | 265,600 | 2.9% |
| Top 1% | 56 million | 37% | 6 million | 2 million | 3.1% |
| Top 0.1% | 5.6 million | 19% | 30 million | 7 million | 3.8% |
| Top 0.01% | 556,000 | 11% | 173 million | 38 million | 4.5% |
| Top 0.001% | 56,000 | 6% | 986 million | 254 million | 4.9% |
| Top 0.0001% | 5,600 | 3% | 5 billion | 1 billion | 5.3% |
| Top 0.00001% | 560 | 0.8% | 12 billion | 4 billion | 8.4% |
| Top 0.000001% | 56 | 0.3% | 53 billion | 22 billion | 8.5% |
Source: World Inequality Report 2026
5. Top 0.0001% (99.9999th Percentile)
The billionaire tier begins at the top 0.0001% (one in every one million), representing just 5,600 adults. The report highlights that this group, small enough to fit in a concert arena, hold a disproportionate share of global wealth compared to most of the world.
So, who belongs to the top 0.0001%? According to Forbes’ billionaire list, this elite group include figures such as Sam Altman, the CEO of OpenAI, with a net worth of around $3.5 billion (€2.97 billion), and global superstar Taylor Swift, with about $2 billion (€1.7 billion).
To explore the net worth and income levels of the wealthiest individuals, here’s a breakdown:
Net Worth of the Top 0.0001%
- Wealth Threshold (Entry Point): The minimum net worth of the richest people in this tier is €1 billion
- Average Wealth: €5 billion per adult
- Share of Global Wealth: These 5,600 people hold 3% of global personal wealth–1.5 times as much as the 2.8 billion people in the bottom 50%, who collectively share 2%
Income of the Top 0.0001%
- Income Threshold (Entry Point): Requires a minimum income of €73.6 million
- Average Income: Earns about €248.1 million per year, on average or over €20 million per month
- By comparison, half of the global population lives on under €500 a month, while the top 10% earn 31 times more and the top 0.0001% nearly 50,000 times more
- Share of Global Income: Captures 1% of the world's total annual income
See Also: 7 Best Wealth Tracking Apps to Monitor Investments with Ease
6. Top 0.00001% (99.99999th Percentile)
Advancing to the top 0.00001% (one in ten million) reveals an inner circle of the world’s billionaires, consisting of only 560 individuals. Among these individuals is Harold Hamm and family, who founded one of the largest independent oil firms in the US, with a net worth of $16 billion (€13.5 billion).
Here’s a closer look at the wealth of the world’s top 0.00001%:
Net Worth of the Top 0.00001%
- Wealth Threshold (Entry Point): Joining the wealthiest people in the world requires a minimum of €4 billion in net worth
- Average Wealth: €12 billion per adult
- Share of Global Wealth: This group of 560 controls 0.8% of global wealth, holding nearly half the wealth of the bottom 2.8 billion people, who collectively hold just 2%
7. Top 0.000001% (99.999999th Percentile)
At the very top sits the 0.000001% (one in one hundred million), a tier reserved for the top ten richest people in the world. It includes Elon Musk, Larry Page, and Sergey Brin, whose fortunes can reach $200 to $700 billion.
This level represents an extreme narrowing of wealth concentration, dropping from 56 million people in the top 1% to just 56 individuals worldwide in the top 0.000001% –a group small enough to fit in a single classroom.
To find out how wealth is distributed among the top 0.000001%, here’s a breakdown:
Net Worth of the Top 0.000001%
- Wealth Threshold (Entry Point): A net worth of at least €22 billion is required to enter this tier
- Average Wealth: The average wealth per adult in this tier is a staggering €53 billion
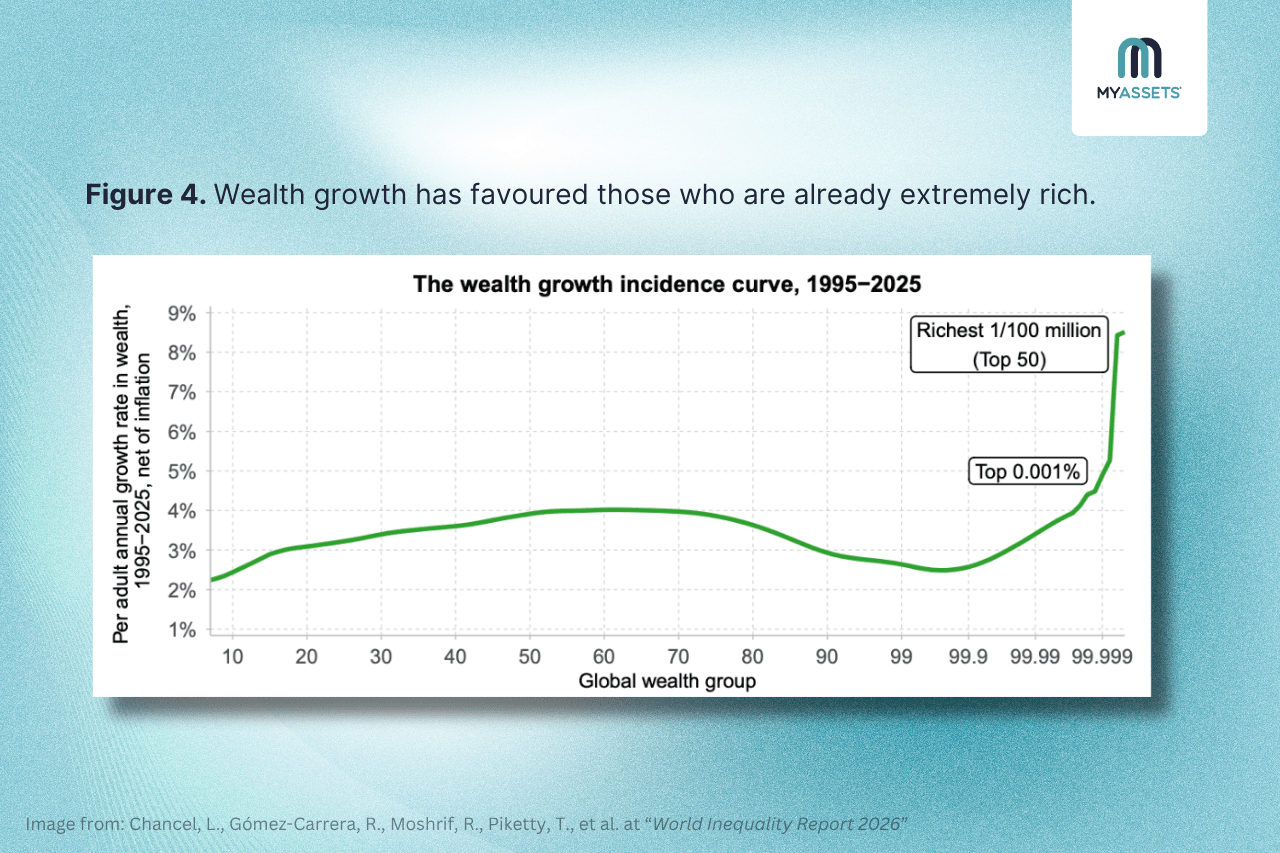
- Wealth Growth: The wealth of the richest people in the world has grown at 9% annually since 1995, nearly three times faster than the global average adult (See figure 4)
- Share of Global Wealth: This group of 56 controls 0.3% of global personal wealth
Wealth of the Top 1 Per cent in the World: Numbers Revealed
The wealth of the top 1% becomes increasingly concentrated at each higher level. From the top 1% to the ultra-elite top 0.000001%, each level represents a dramatic narrowing of the population and a sharp rise in average wealth.
This becomes clearer when looking at the wealth thresholds required to enter each tier. To illustrate the entry levels for the most exclusive wealth tiers, the World Inequality Report provides estimated per-adult thresholds:
- Top 1%: €2 million ($2.3 million) – The millionaire entry bracket
- Top 0.1%: €7 million ($8.1 million) – The high-net worth individual
- Top 0.01%: €38 million ($43.8 million) – The ultra-high net worth individuals' entry bracket
- Top 0.001%: €254 million ($292.5 million) – The 60,000 ultra-wealthy group
- Top 0.0001%: €1 billion ($1.2 billion) – The official entry point for global billionaires
- Top 0.00001%: €4 billion ($4.6 billion) – The world's wealthiest 500 individuals
- Top 0.000001%: €22 billion ($25.3 billion) – The ultra-exclusive tier of the world's top 50
Ultimately, these thresholds highlight how quickly wealth escalates at the very top, reinforcing how a tiny fraction of individuals holds a disproportionately large share of global wealth.
Net Worth of the Top 1 Per cent: Frequently Asked Questions
1. What is the net worth of the top 1 per cent?
The net worth required to be in the top 1 per cent globally is around €2 million (about $2.3 million) per adult. However, this threshold varies widely by country, with much higher levels needed in wealthier regions.
2. Who is the richest man in the world?
As of recent rankings, the richest man in the world is Elon Musk, with a net worth of over $700 billion.
3. How much wealth do the top 1% have in the UK?
In the UK, the top 1% households command a minimum net wealth of about €3.6 million (around £3.1 million).
MyAssets: Your Personal Net Worth Calculator
Knowing where one fits in the global wealth percentile is one thing; having the data to prove it is another.
While the numbers from the World Inequality Report are staggering, they remain abstract until applied to an individual’s own balance sheet. After all, no one can realistically aim for the “stadium” of the top 0.001% without first knowing exactly where they stand.
This is where a net worth tracking tool like MyAssets becomes essential.
Designed to organise, track, and manage assets, MyAssets gives users a full 360-degree view of their wealth by consolidating information from all accounts in one place.
A Single Dashboard to Measure Wealth
It pulls in everything:
- Bank accounts (checking and savings)
- Collectable investments (art, wine, watches, etc.)
- Investment portfolios (stocks, bonds, and mutual funds)
- Properties (residential, rental, and commercial)
It gets better. MyAssets doesn’t just show one’s assets; it also incorporates their liabilities, such as:
- Credit card debts
- Loans
- Mortgages
Imagine having all this information presented in a visually appealing dashboard. With MyAssets, monitoring net worth becomes straightforward as the platform transforms raw numbers into dynamic charts. It offers a breakdown of resources across finances, properties, collectables, and even belongings, making it easier to understand overall wealth.
A System to Manage Relationships Between Assets
Even better, users can manage relationships between assets with its Smart Asset Linking feature. In practice, this means users can connect related items, like the first bought home with its mortgage or the belongings it houses. This helps understand how assets relate to one another and their impact on one’s net worth and portfolio.
Track all your assets and see where you stand financially with MyAssets, free for 14 days.