


Today, wealth inequality has reached a point where even the word “gap” no longer captures its scale. As highlighted by the World Inequality Report 2026, the top 1% sits at the very peak of the global wealth percentile, holding a significant share of global wealth.
To visualise the scale: if global wealth were a single loaf of bread, the elite 1% wouldn't just take one slice; they would claim nearly the entire loaf, leaving everyone else to compete for the crumbs.
The pattern of wealth concentration is similarly reflected at the national level, particularly in the United Kingdom (UK). According to The Sunday Times, the combined wealth of the UK’s ten richest billionaires surged from £47.77 billion in 2009 to £182 billion in 2022.
This points to a UK wealth distribution that favours the elite, with a 281% increase showing how rapidly British wealth has accumulated among the richest group. This solidifies the top 1%’s position and widens the gap between the wealthiest households and the rest of the population.
And yet, for most people, the real challenge isn’t just inequality; it’s not knowing where they stand. Most households know their income, but not how their total wealth compares with others.
This article helps address that by exploring wealth distribution across the UK, particularly Great Britain (England, Scotland, and Wales), to help identify where an individual stands within the wealth percentiles.
- What is Wealth Distribution?
- Wealth Distribution in the UK
- Wealth Distribution by Percentile
- Breakdown of Total Wealth by Component
- Median Household Wealth in Great Britain
- Summary of Wealth Distribution Across Households in Great Britain
- British Wealth: Frequently Asked Questions
What is Wealth Distribution?
Wealth distribution refers to how a nation’s total wealth is divided among its population. To understand this more clearly, it is relevant to consider what wealth is actually made of beyond income.
Definition of Wealth
An accurate measure of wealth is net worth, calculated as total assets minus total liabilities.
To break this down further, wealth is typically built through the following assets:
- Finances (savings, stocks, bonds, and other investments)
- Physical Assets (vehicles, household items, art and collectables)
- Real Estate (homes, lands, buildings, and other real estate investments)
These assets are then offset by financial obligations, which may include:
- Auto loans
- Credit card debt
- Medical bills
- Mortgages
- Outstanding insurance premiums
- Personal loans
- Student loans
- Taxes owed
In this way, individuals gain a complete picture of their financial standing, reflecting not only what they own but also what they owe.
Understanding Wealth Distribution Through Percentiles
Wealth distribution can be understood by dividing the population into percentiles. Instead of focusing only on absolute figures, percentiles show where a household stands relative to others.
Each percentile represents a position within the overall distribution and is generally categorised into:
- Bottom 10% (10th percentile): Represents the lowest tenth of wealth holders
- Median (50th percentile): The midpoint of the wealth distribution
- Top 25% (75th percentile): The upper quartile of wealth holders with higher wealth than 75% of the population
- Top 10% (90th percentile): Households with higher wealth than 90% of the population
- Top 1% (99th - 100th Percentile): The most affluent 1% of the population
Wealth Distribution in the UK
The latest report by the Office for National Statistics (ONS) highlights that between April 2020 and March 2022, nearly half (49%) of UK households in Great Britain possessed £300,000 or more in wealth.
The table below presents a breakdown of UK household percentages by wealth band.
Table 1. Wealth bands and household distribution in percentage.
| Wealth band | % of households |
|---|---|
| Less than £20,000 | 12 |
| £20,000 to £84,999 | 16 |
| £85,000 to £199,000 | 14 |
| £200,000 to £299,000 | 10 |
| £300,000 to £499,000 | 15 |
| £500,000 to £999,999 | 20 |
| £1 million or more | 14 |
Source: Office for National Statistics, Total Wealth: Wealth in Great Britain (2025)
Overall, 14% of households hold over £1 million total wealth, whilst 12% have less than £20,000.
Learn More: 5 Powerful Strategies to Increase Your Net Worth
Wealth Distribution by Percentile
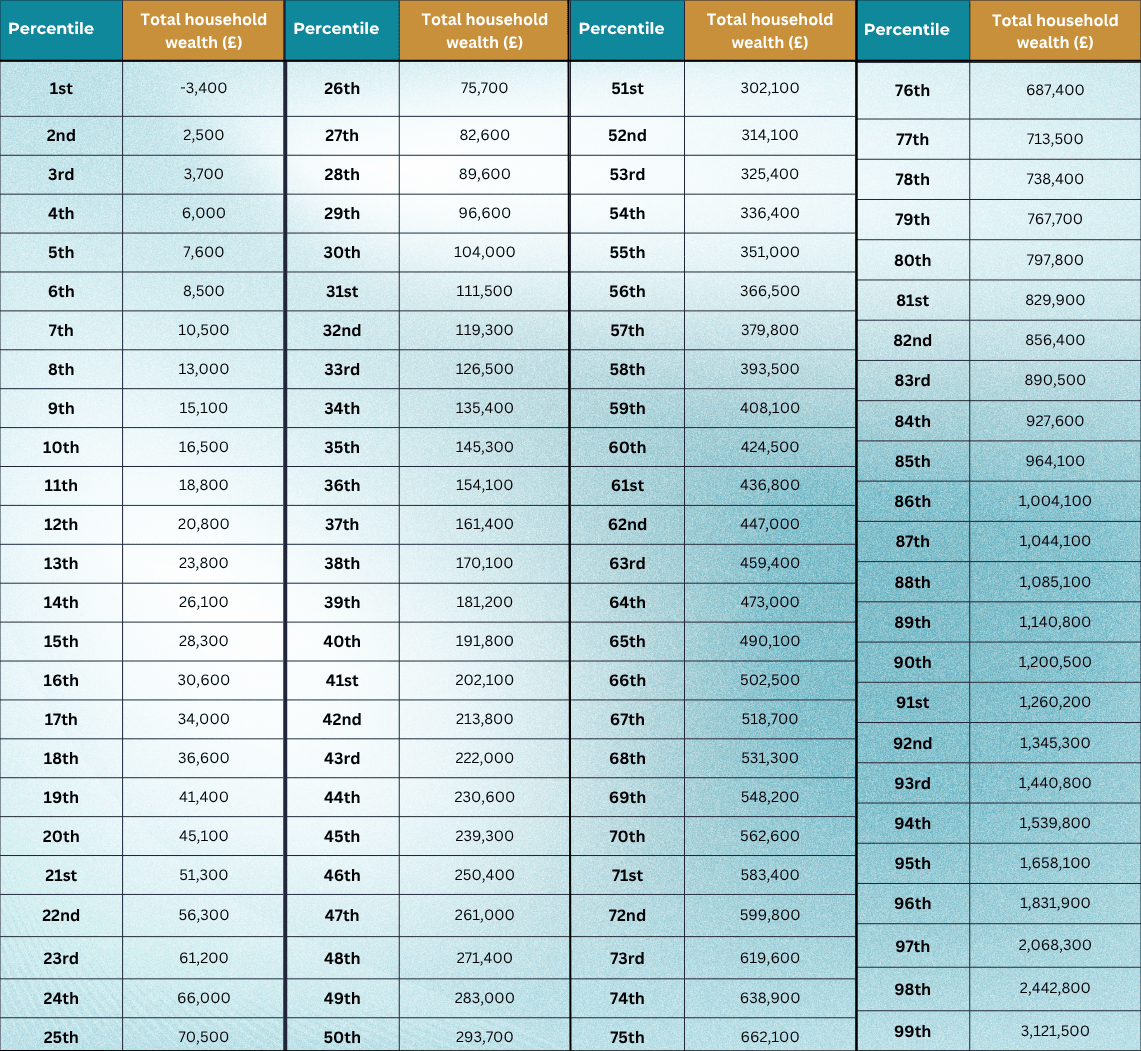
Wealth in Great Britain varies significantly when broken down by percentiles. The ONS percentile data below shows how it is spread across the population.
Table 2. Wealth distribution in percentiles.
Source: Office for National Statistics
In summary:
- 1st – 20th Percentiles: Households with very low or negative net worth, often including renters or younger households with limited asset ownership and higher debt levels. Wealth ranges from -£3,400 to £45,100
- 21st – 50th Percentiles: With net worth ranging from £51,300 to £293,700, this wealth bracket in the UK is generally in the early to mid-stages of wealth accumulation, building equity through property, savings, or modest pension assets
- 51st – 80th Percentiles: This group includes many homeowners with established savings and pensions, reflecting a comfortable financial position. Wealth ranges from £302,100 to £797,800
- 81st – 95th Percentiles: Affluent households, many of which fall into millionaire status, with wealth ranging from £829,900 to £1,658,100
- 96th – 99th Percentiles: The wealthiest tier, typically holding highly diversified asset portfolios, with net wealth ranging from £1,831,900 to £3,121,500
- Survey reports that the UK’s top 1% with wealth of at least £3,121,500, own 10% of total wealth, equivalent to the combined share of the least wealthy 50%
The data reveal a significant wealth inequality in the UK: the wealthiest 10% (90th to 99th percentiles) hold at least £1,200,500 in net worth and enjoy a high level of financial security, and the least wealthy 10% own £16,500 or less, often with little to no financial safety net.
Breakdown of Total Wealth by Component
As mentioned, wealth comprises different components, including property, financial assets, pensions, and physical possessions. To understand how wealth is distributed across these categories, Figure 1 provides a breakdown of household asset composition in percentages.
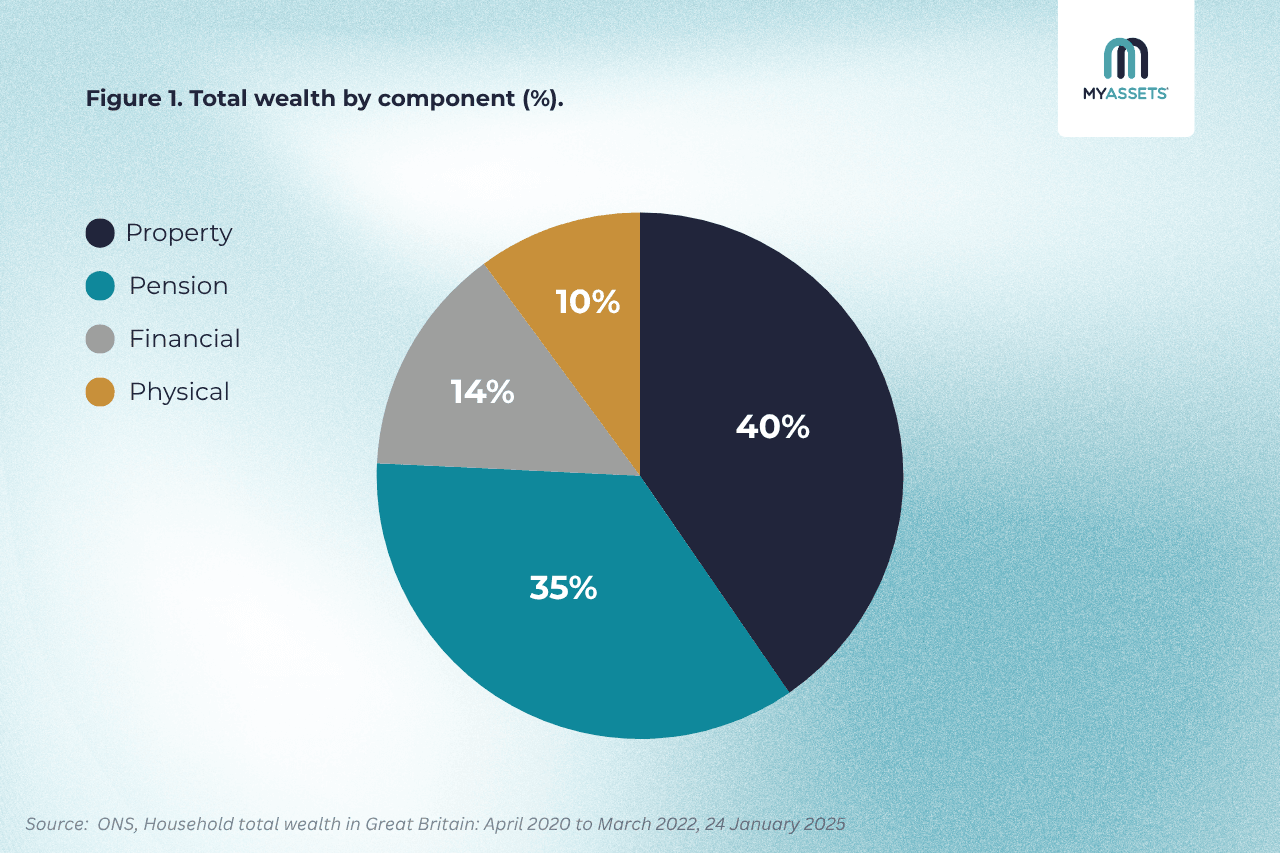
In summary, property accounts for the largest share of UK household wealth at 40%, followed by private pensions at 35%. Net financial wealth makes up 14%, while physical assets account for 10%. This highlights that most household wealth is tied up in illiquid assets (housing and pensions), rather than easily accessible financial holdings.
Median Household Wealth in Great Britain
The median (50th percentile) represents the exact middle of the economic spectrum; it is the point where 50% of households own more and 50% own less. Unlike the average wealth in the UK, skewed by a small number of UK billionaires, the median provides a more realistic snapshot of the typical household.
The median household wealth in Great Britain stood at £293,700 between April 2020 and March 2022. However, this figure is heavily dependent on retirement savings. When private pension wealth is removed, the median drops significantly to £181,700 (See figure 2).
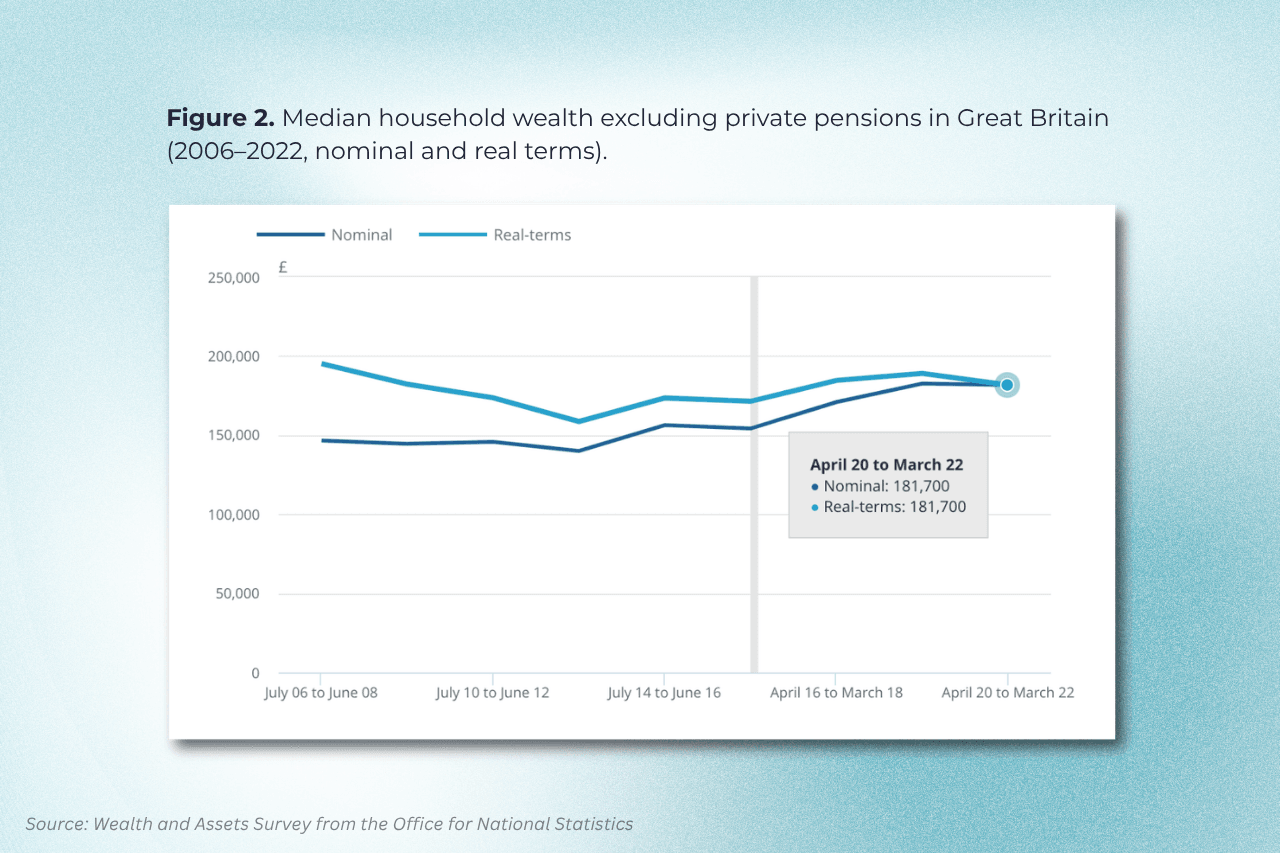
The nearly £112,000 difference between the two medians shows that a large portion of wealth in Great Britain is locked in pensions. While this provides long-term security, it isn't money that households can access to cover day-to-day expenses or emergencies.
Read More: The Global Middle Class: Income And Wealth Threshold Revealed
Median Household Wealth by Region
Regional location is one of the key factors influencing household net worth. Figure 3 shows a clear gap between the highest and lowest wealth regions:
- South East: £489,800, roughly three times higher than the lowest region
- North East: £179,900
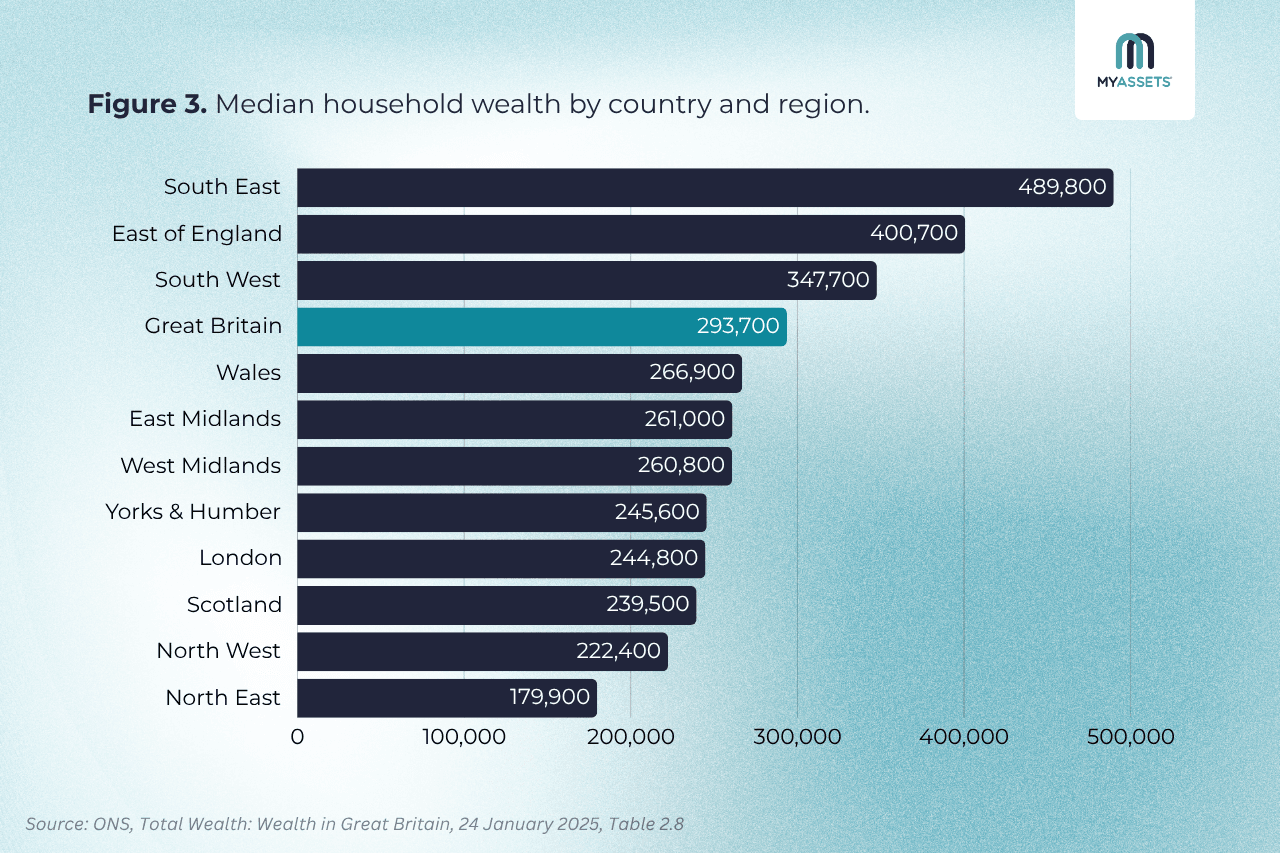
This highlights that a typical household in the South East (£489,800) is more than two times (£489,800) wealthier than its counterpart in the North East (£179,900).
Summary of Wealth Distribution Across Households in Great Britain
Wealth distribution in Great Britain is highly uneven, with clear differences emerging across households.
- Lower percentiles hold very limited or even negative net worth
- The middle group builds wealth through housing, savings, and pensions
- Upper percentiles control highly diversified and significantly larger asset bases
At the extremes, the gap becomes particularly pronounced, with the top 1% controlling around 10% of total wealth, a share equivalent to that held by the least wealthy 50% of households combined.
Across all households, wealth is primarily concentrated in property and pensions, which together account for the majority of total assets.
Overall, Britain's richest people hold a disproportionate share of total wealth, with long-term asset ownership playing a central role in financial standing.
British Wealth: Frequently Asked Questions
1. What is the average wealth in the UK?
A more realistic measure of average is median household wealth, which is £293,700, representing the middle point of the UK population.
2. What net worth is considered wealthy in the UK?
In the UK, a net worth of at least £1 million is typically considered wealthy, as it places a household in the top 10%.
3. Is £2 million in assets rich in the UK?
£2 million in assets is generally considered wealthy, as it is well above the top 10% threshold of around £1.2 million. However, it falls short of the top 1%, which starts at roughly £3.1 million, meaning it is affluent but not ultra-wealthy.
MyAssets: Your All-in-One Net Worth Tracker
While knowing the wealth deciles is useful, it only becomes meaningful when applied to personal finances. After all, it is not possible to realistically aim for the top 1% without first knowing one’s current position on the wealth ladder.
This is where a net worth tracking tool like MyAssets becomes essential.
Designed to organise, track, and manage assets, MyAssets gives users a full 360-degree view of their wealth by consolidating information from all accounts in one place.
A Single Dashboard to Measure Wealth
It pulls in everything —from bank accounts (checking and savings), investment portfolios (stocks, bonds, and mutual funds), and properties (residential, rental, and commercial), to valuable assets like collectable investments (art, wine, watches, etc.).
It gets better. MyAssets doesn’t just show one’s assets; it also incorporates their liabilities, such as:
- Credit card debts
- Loans
- Mortgages
Imagine having all this information presented in a visually appealing dashboard. With MyAssets, monitoring net worth becomes straightforward as the platform transforms raw numbers into dynamic charts. It offers a breakdown of resources across finances, properties, collectables, and even belongings, making it easier to understand overall wealth.
A System to Manage Relationships Between Assets
Even better, users can manage relationships between assets with its Smart Asset Linking feature. In practice, this means users can connect related items, like the first bought home with its mortgage or the belongings it houses. This helps understand how assets relate to one another and their impact on one’s net worth and portfolio.
Track all your assets and see your true wealth with MyAssets, free for 14 days.



